
Simulation of an Aquaculture Tank
Perfilado de sección
-
-


I believe that science-based aquaculture will help to ensure sustainable and stable food production (SDG 2).
The United Nations has designated the decade starting in 2021 as the "Decade of Ocean Science," with the aim of contributing to the SDGs. Ocean science, as defined by the UN, includes the field of fisheries.
-
-
Aquaculture production has significantly increased.
Globally, it recently exceeded the production by fishing boats and fisheries.
Our laboratory aims to improve the efficiency of aquaculture production by conducting simulation research.
-
Our laboratory is working on visualizing the flow in the culture tank using fluid simulation (CFD analysis) and visualization experiment (PIV experiment), with the aim of improving the breeding environment in the tank.
Complete aquaculture has the highest mortality rate in seedling production (from hatching to the larval stage), which has been a bottleneck for mass production.
It is known that fish at the larval stage are easily affected by the flow in the aquarium due to their low swimming ability and are prone to sinking death (a phenomenon in which they are damaged and die when hitting the bottom of the aquarium).
To prevent sinking death, the flow field in the aquarium must be set to avoid a sudden downward flow.
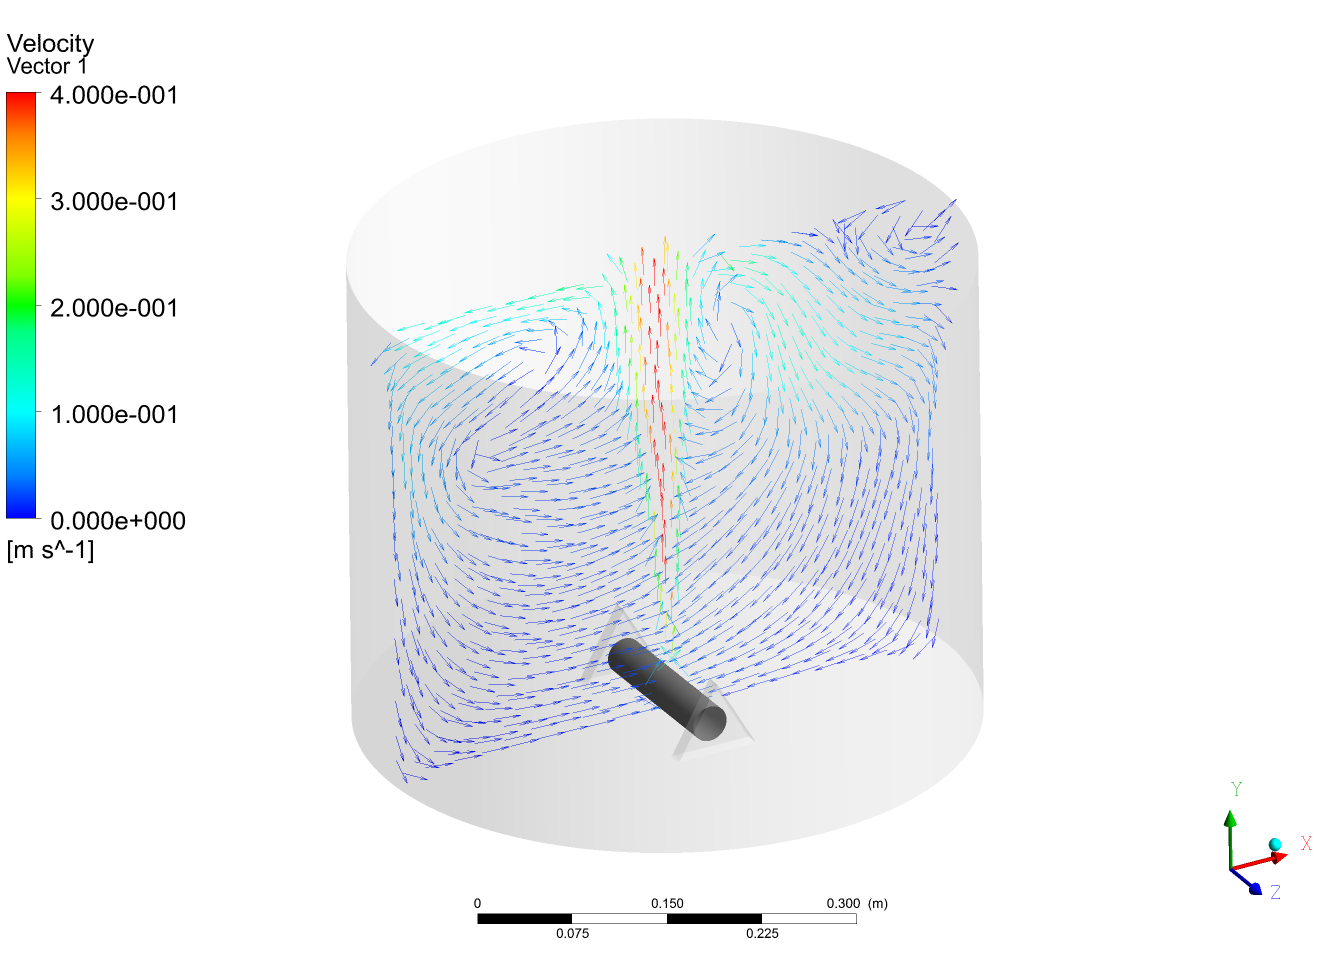
Figure 1. The flow field in an aquarium generated by aeration.
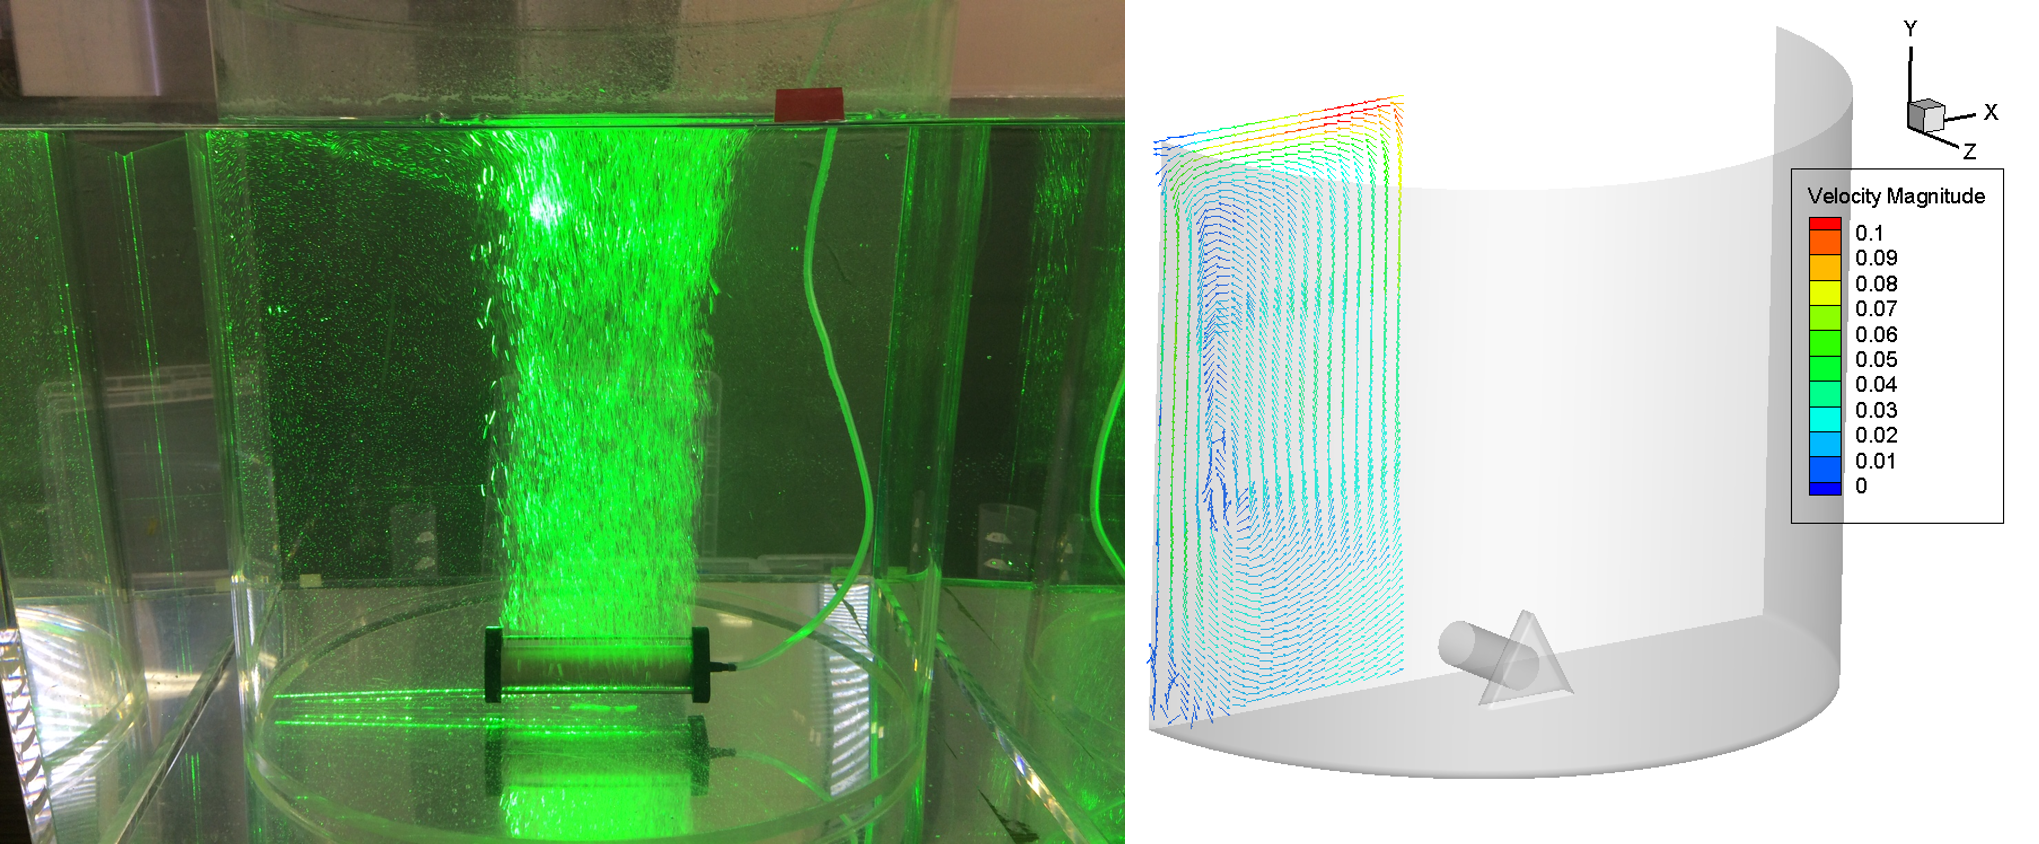
Figure 2. Visualization experiment targeting the flow field generated by aeration.
-
The cost of feed in aquaculture production is high, but efficient feeding is expected to reduce the cost.
Currently, we are working on simulating the feeding behavior of fish and their growth by coupling the fish school behavior model (Boid model, see separate section) and the growth model.
Here, the differences in growth between the following two types (A: wide-range feeding, B: narrow-range feeding) are compared by simulation.
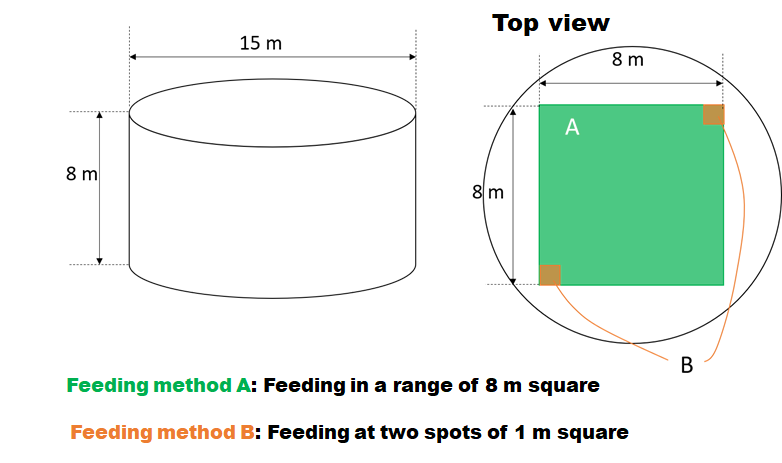
Figure 3. Feeding range in the simulation
Video 1. Simulation of feeding condition A
Video 1. Simulation of feeding condition B
We plan to use this simulation to identify the most profitable feeding method in the future.The final growth results are shown below. Feeding over a wide range (feeding condition A) resulted in less variation.
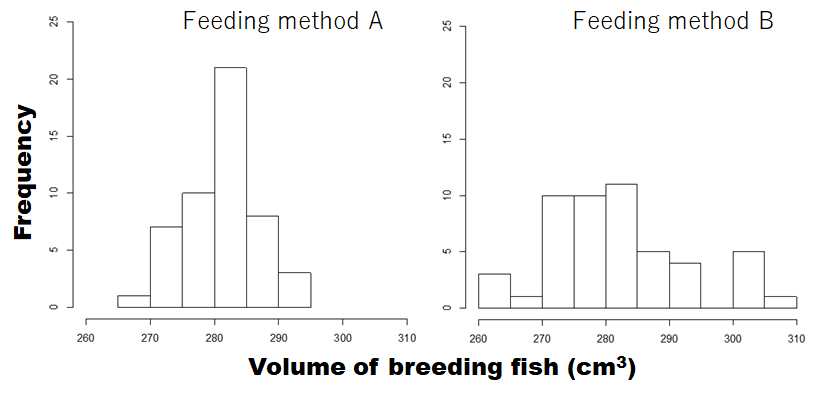
Figure 4. Breeding results after 90 days


