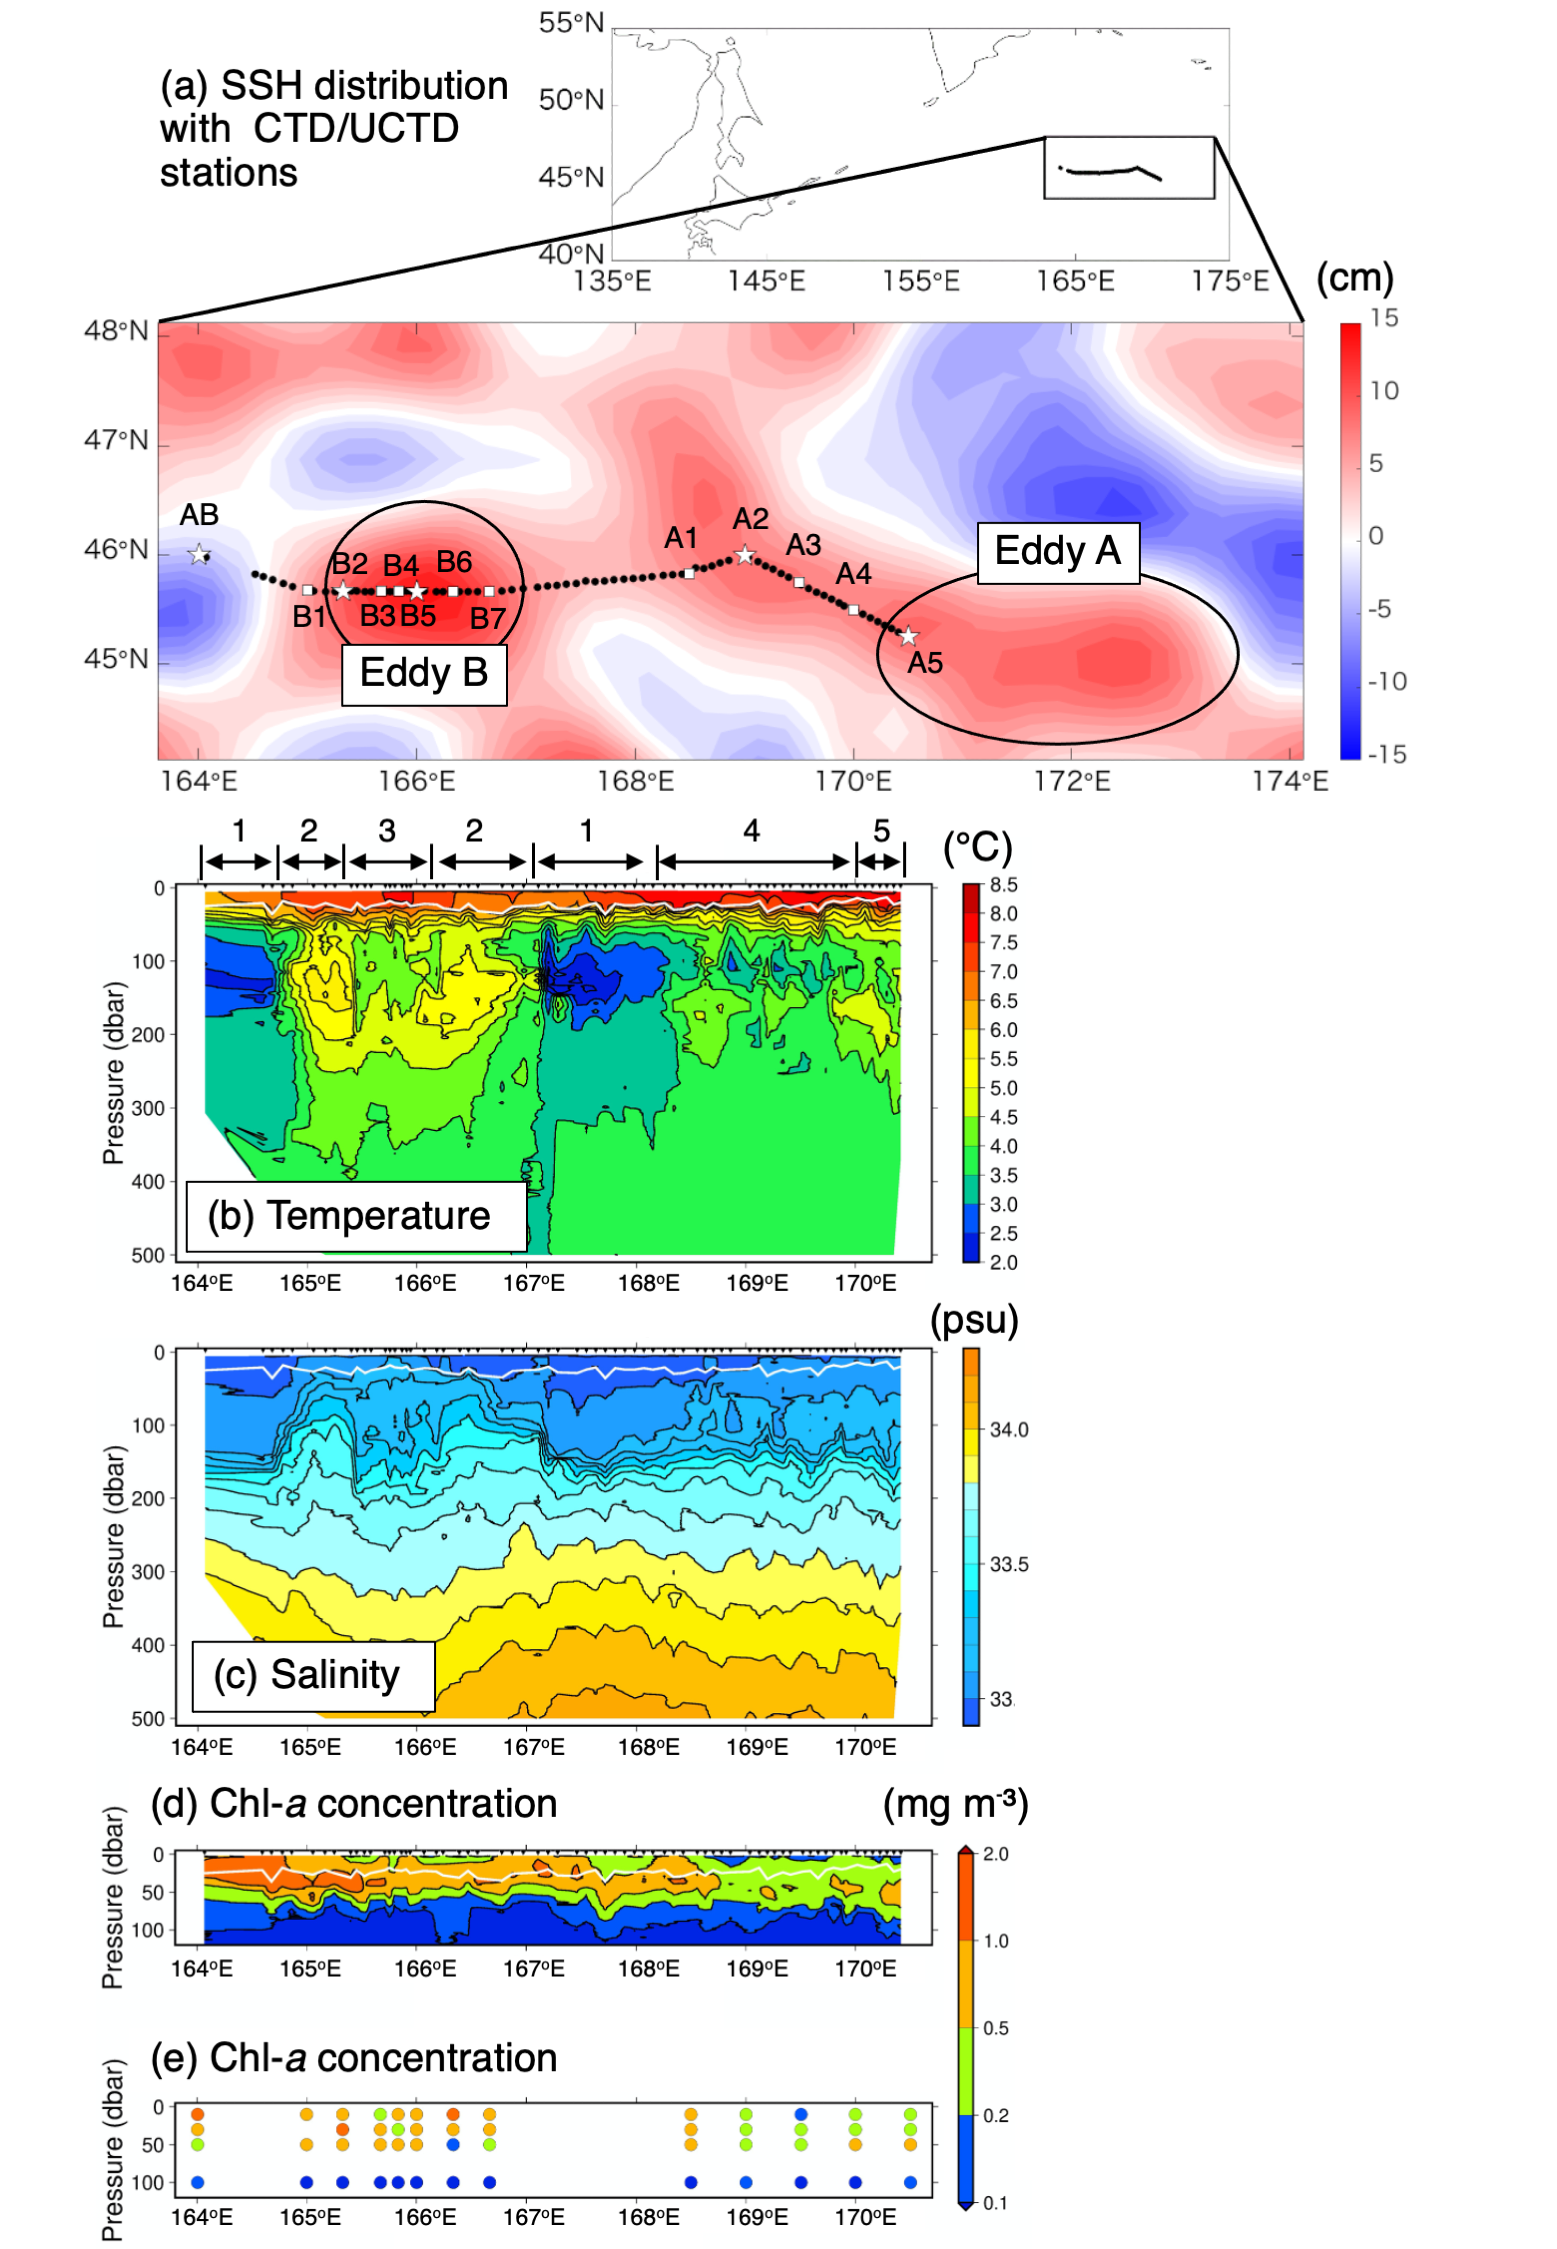
In this study, we mainly used data observed from June to July 2016 by Oshoro maru, a training ship of the Faculty of Fisheries Sciences, Hokkaido University. The ship observations allowed us to capture two eddies ("eddy A" and "eddy B") in the open ocean in the western subarctic region (Figure 2).
In the interior of eddy A and B, downward deflection of isotherms, a structure characteristic of anticyclonic eddies, was observed (Fig. 2b). On the other hand, the chlorophyll concentration showed no significant difference between the inside and outside of the eddies. Therefore, it is suggested that the influence of the observed oceanic mesoscale eddies on the chlorophyll concentration was small.
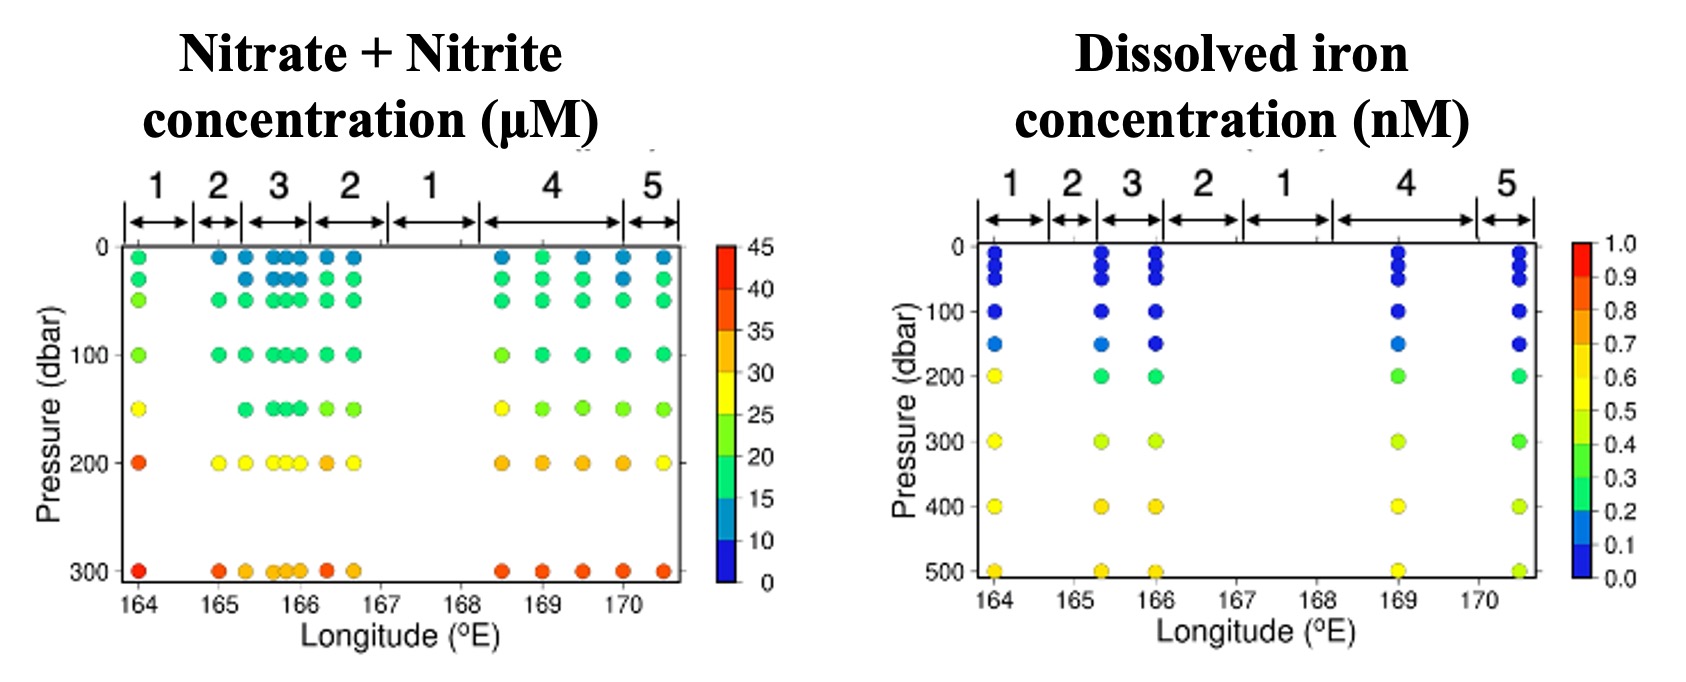
We examined the distribution of nutrients in the surface layers inside and outside the eddy, and found that while the concentration of macro nutrients such as nitrate was high, the concentration of dissolved iron was low, suggesting that biological production was limited by the low concentration of iron both inside and outside the eddy (Figure 3).

Figure 2. (a) CTD stations (without iron observations: ○), CTD stations (with iron observations: ☆), and UCTD stations (●). Colors indicate sea surface height on July 1, 2016. Eddy A and Eddy B are eddies observed in this observation. (b) Water temperatures observed by UCTD (unit: °C); Area 1 indicates open ocean water found in the North Pacific subarctic region, Area 2 indicates the Eddy B fringe, Area 3 indicates the Eddy B center, Area 4 indicates the area of high sea level but not eddy, and Area 5 indicates the Eddy A fringe. (c) Salinity observed by UCTD (unit: psu) (d) Chlorophyll concentration observed by UCTD (unit: mg m-3). (d) Chlorophyll concentration observed by water sampling (unit: mg m-3). White lines in (b), (c) and (d) indicate the depth of the mixed layer*2.

Figure 3 (a) Nitrate + nitrite concentration (unit: μM) and dissolved iron concentration (unit: nM). Areas 1 to 5 are the same as Areas 1 to 5 in Figure 2b.
*2 The mixed layer depth differs from the figure in the paper. In the paper, the mixed layer depth was defined as the depth where the in-situ density is the in-situ density of the surface layer + 0.03 kg m-3, but in this figure, it is defined as the depth where the potential density is the potential density of the surface layer + 0.03 kg m-3.