
Global distribution of dissolved oxygen
セクションアウトライン
-
-
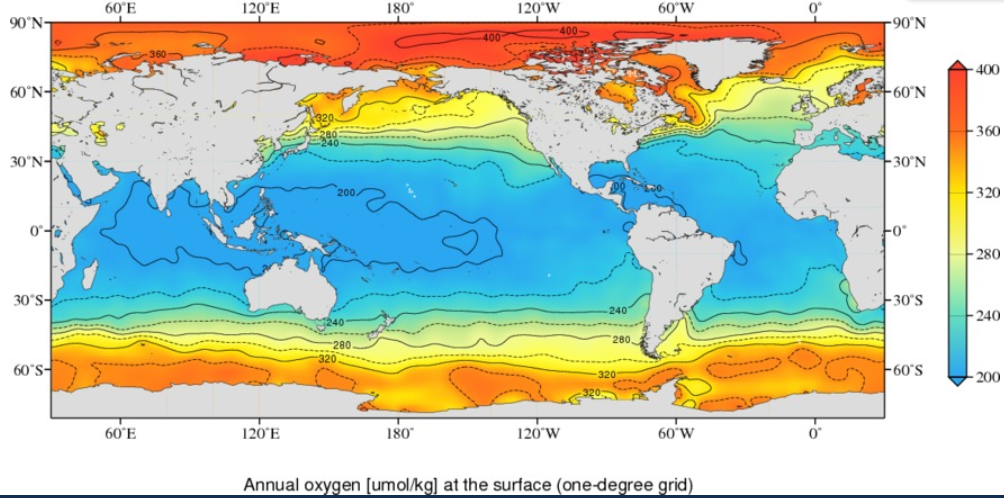
Contour diagram of oxygen concentration (µmol/kg) at the ocean surface is shown. These are annual average climatic values.
Since the lower the water temperature, the greater the solubility of gases, the higher the concentration of oxygen in surface water in cold water (high latitudes). Conversely, it is low in tropical and subtropical regions with high water temperatures.【Distribution of Oxygen Concentration at the Ocean Surface】
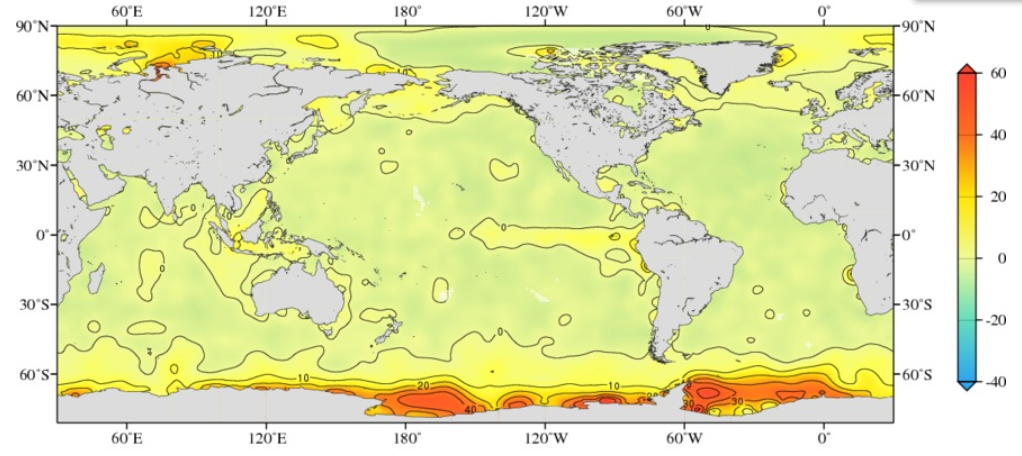
Below is the distribution of Apparent Oxygen Utilization (AOU). If oxygen in the atmosphere and at the ocean surface had reached equilibrium, oxygen consumption would be zero (AOU = 0). In reality, the AOU will take positive or negative values as oxygen is generated through photosynthesis or becomes supersaturated or unsaturated due to increases or decreases in seawater temperature. AOU is positive at the surface in the Southern Ocean (net consumption is seen). In the Southern Ocean, vertical mixing is active from the surface to the deeper layers, which may be due to the influence of deep water with positive AOU values on the surface. In the equatorial region of the eastern Pacific Ocean, the AOU is also slightly positively biased. This is thought to be due to the upwelling of deep water in this area as well.
【Distribution of Apparent Oxygen Utilization (AOU) at the ocean surface】
-
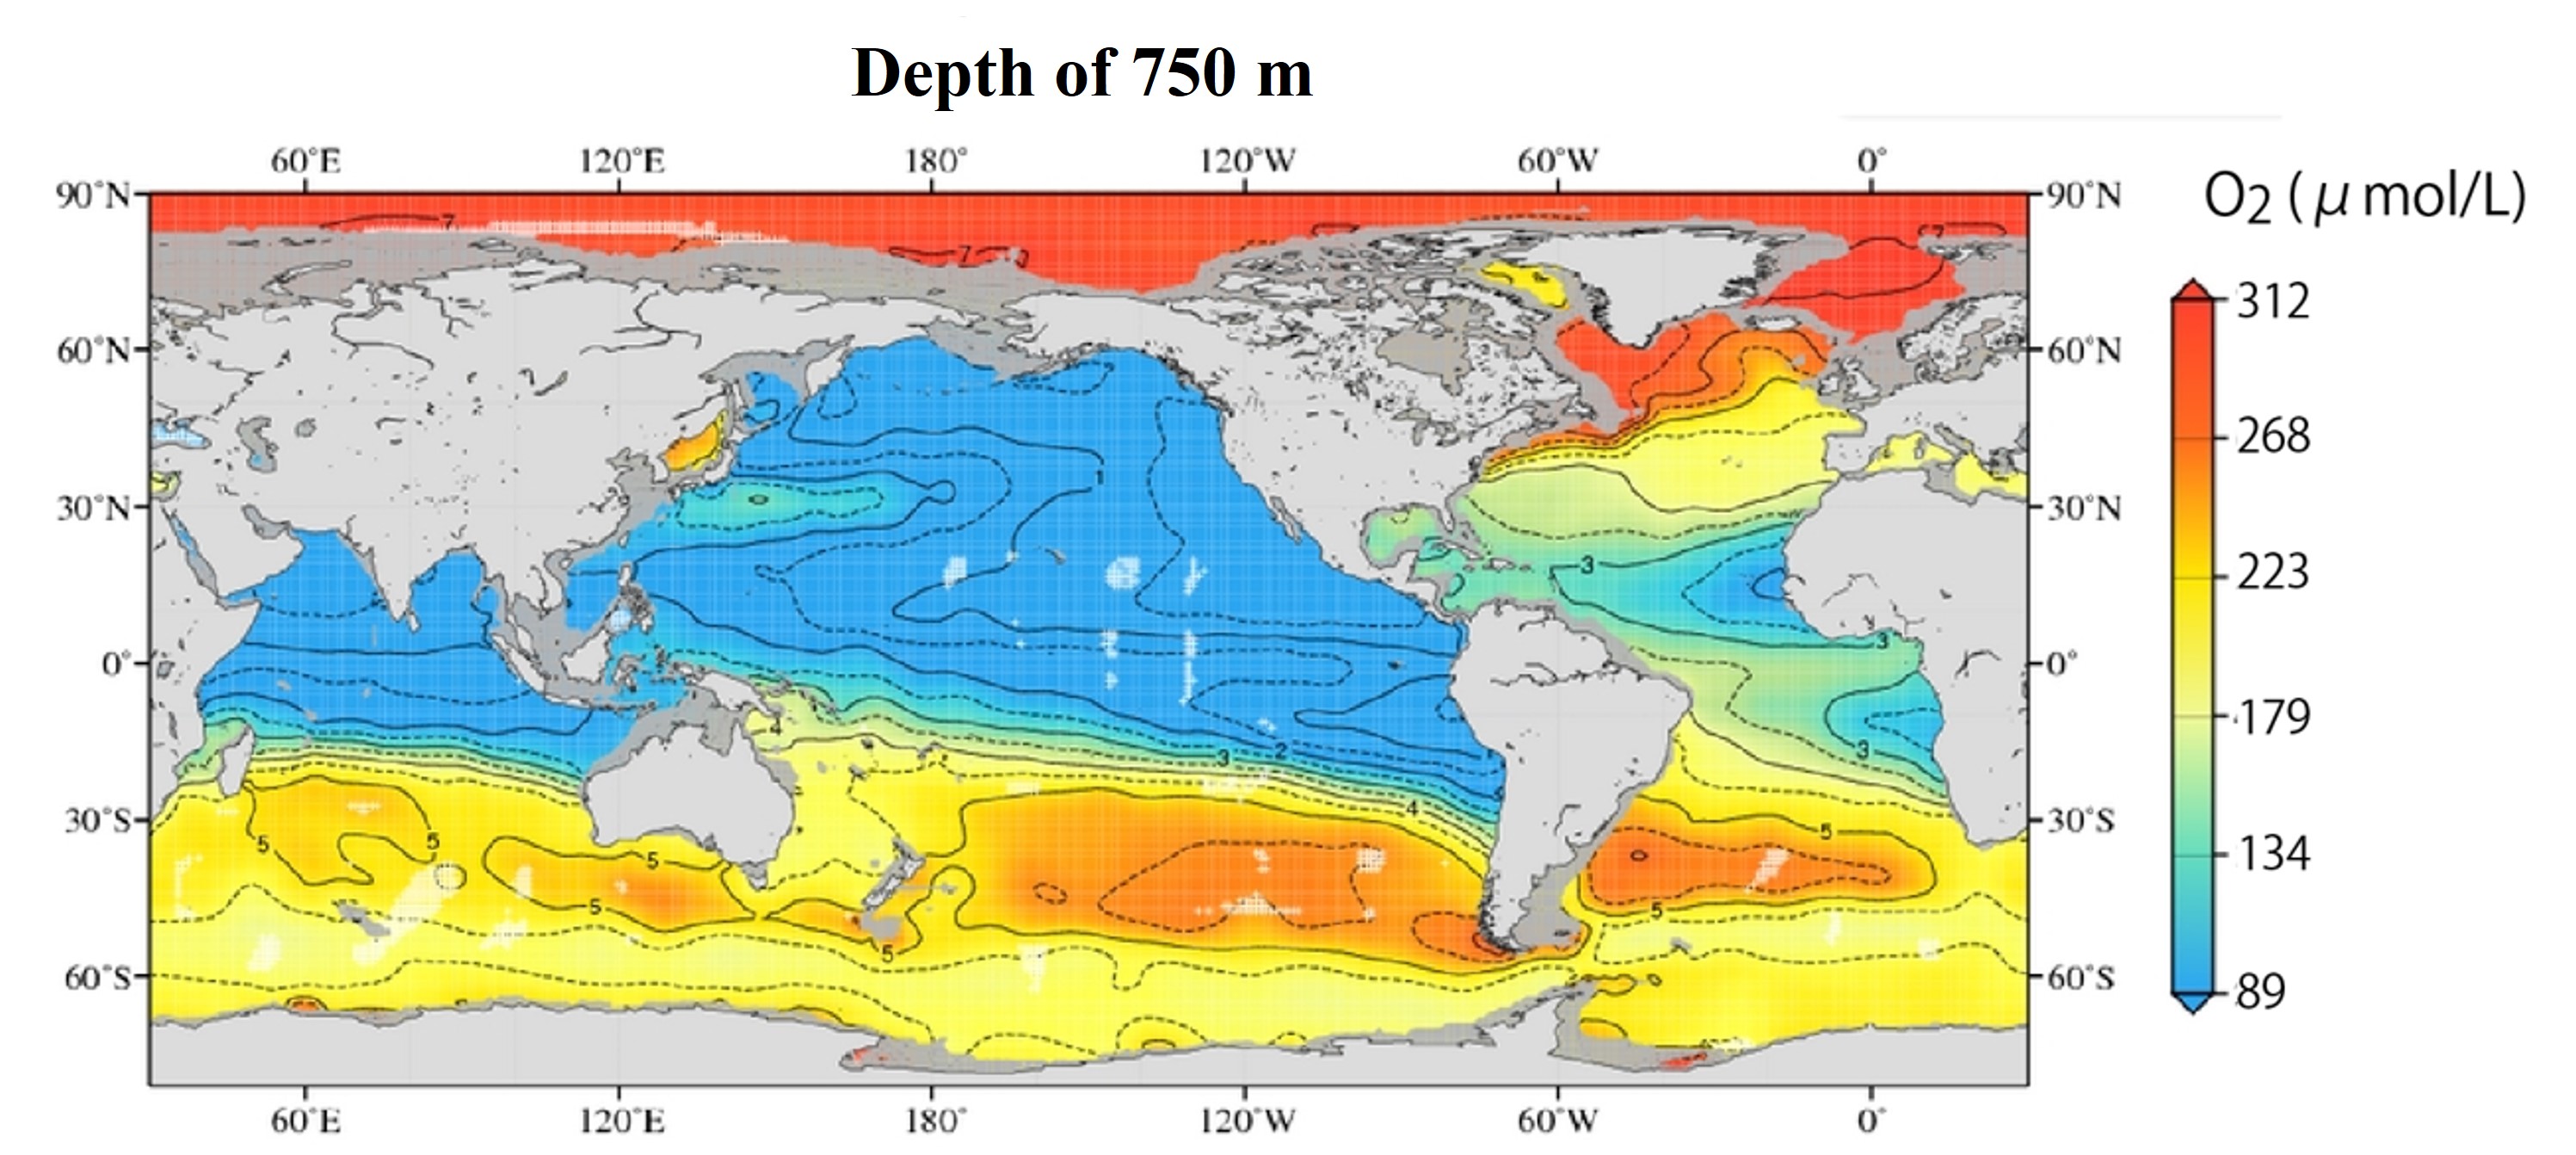
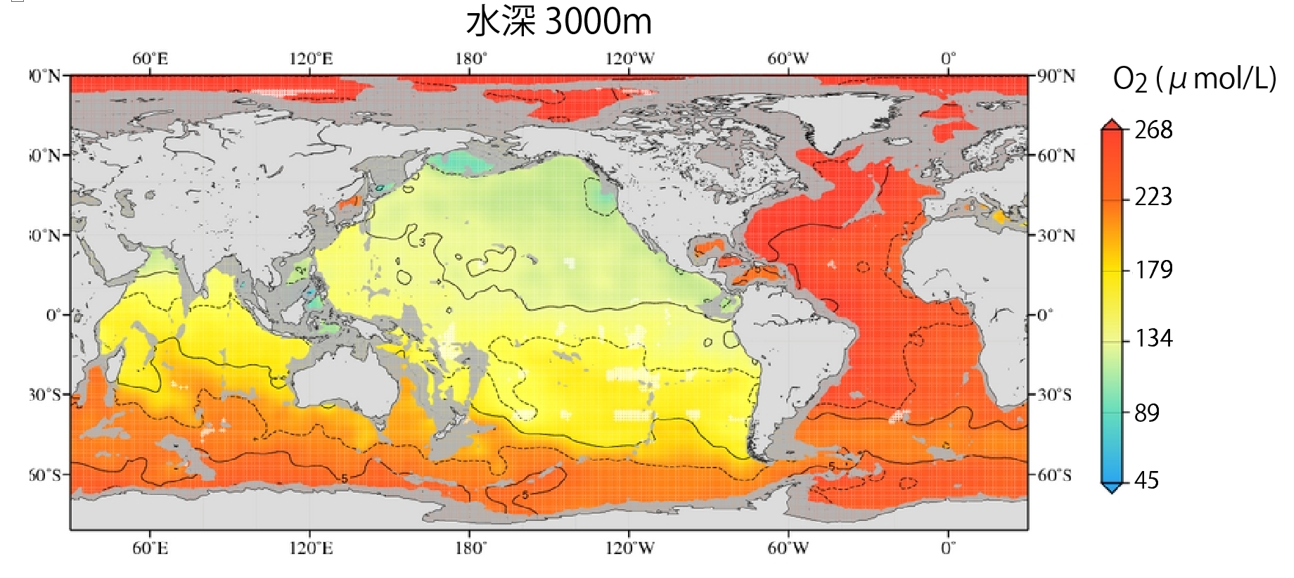
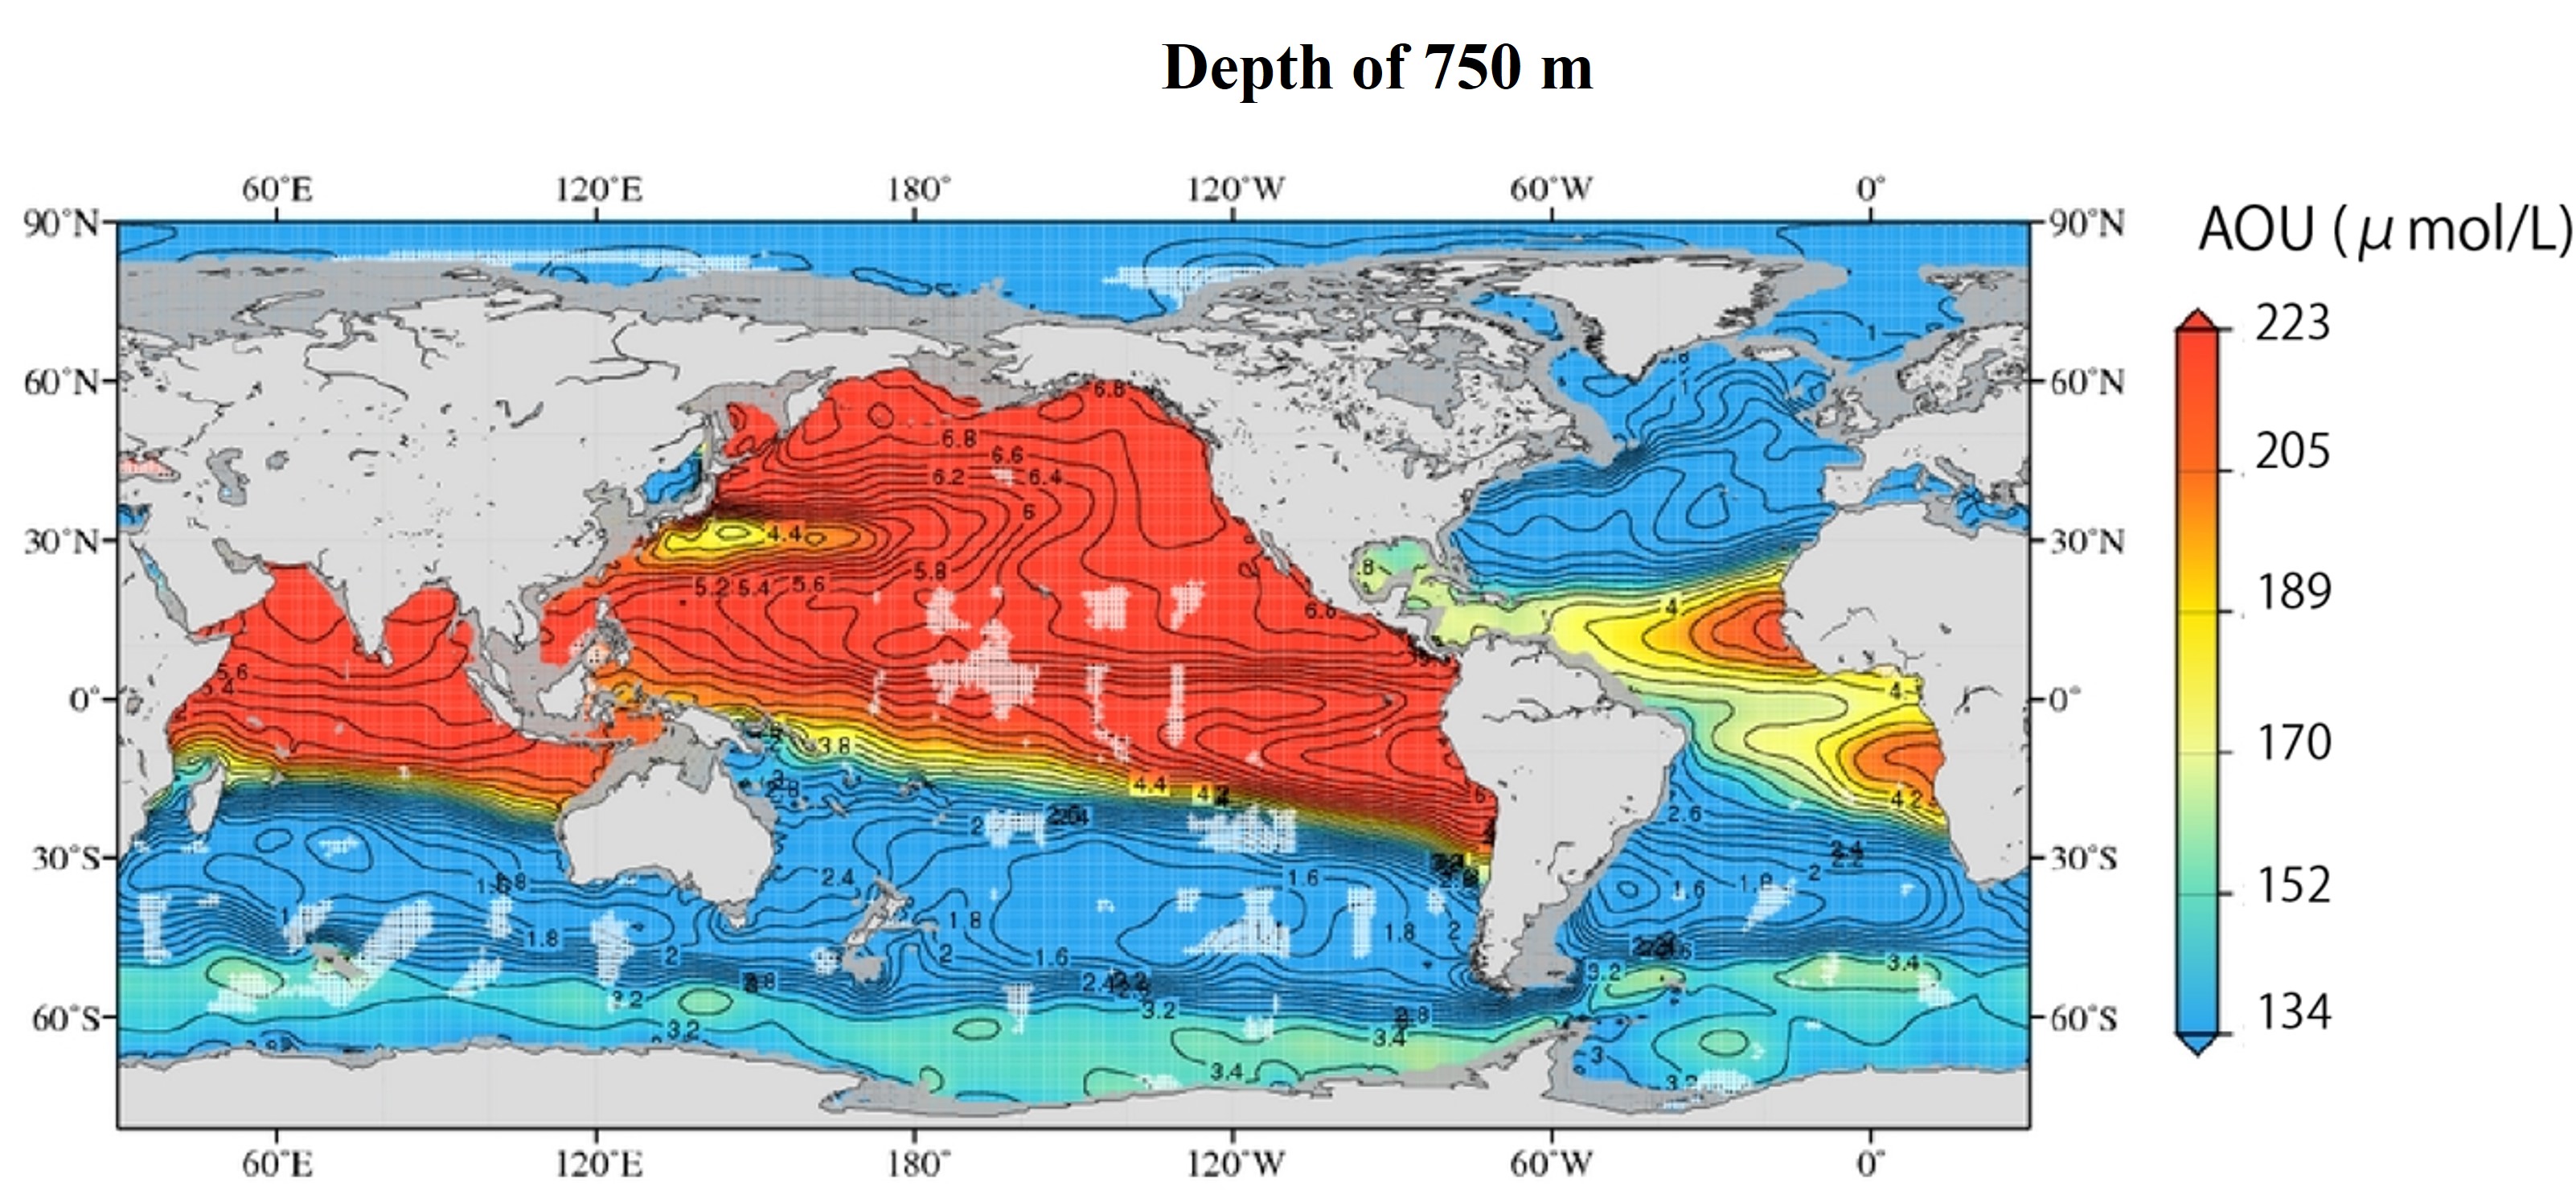
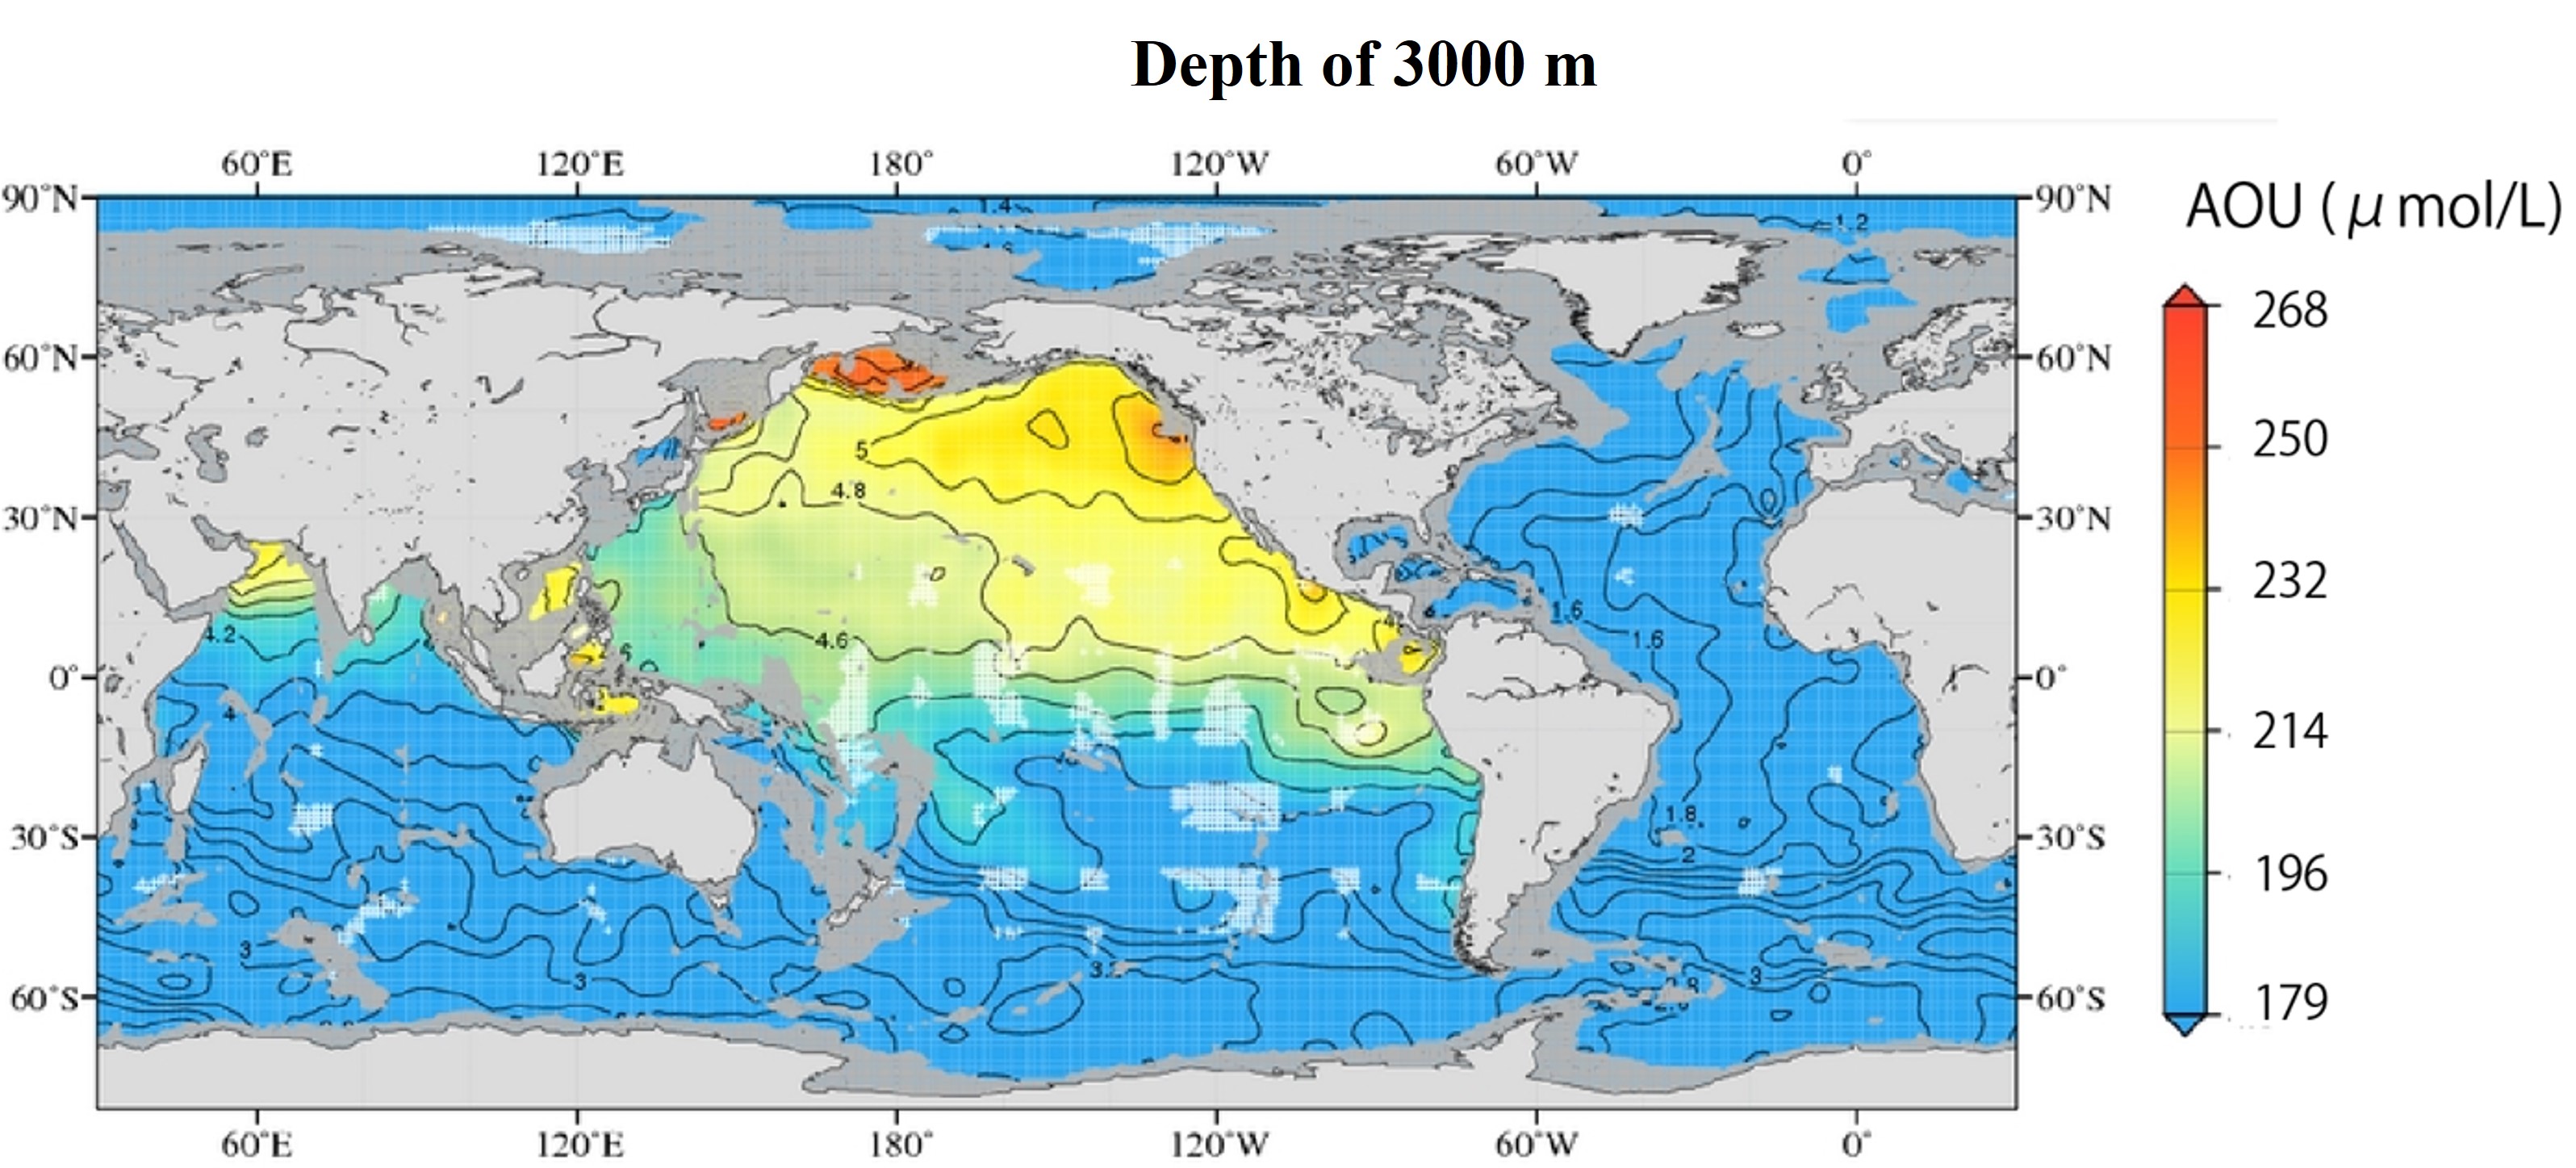
The global distribution of dissolved oxygen concentration at a depth of 750 m, where the oxygen minimum layer is observed, and at a deeper depth of 3000 m.
(Note the different ranges of the color bars in the upper and lower figures.)At a depth of 750 m, oxygen concentrations are lower along the African coast of the Atlantic Ocean. The oxygen concentration is higher in the subtropical Northwest Pacific (around 30°N) than in the surrounding area. Why is this?
-
The following is a map of the distribution of Apparent Oxygen Utilization (AOU) at depths of 750 m and 3000 m in the entire ocean. The AOU are approximately inversely related to the global distribution of oxygen concentrations.
-
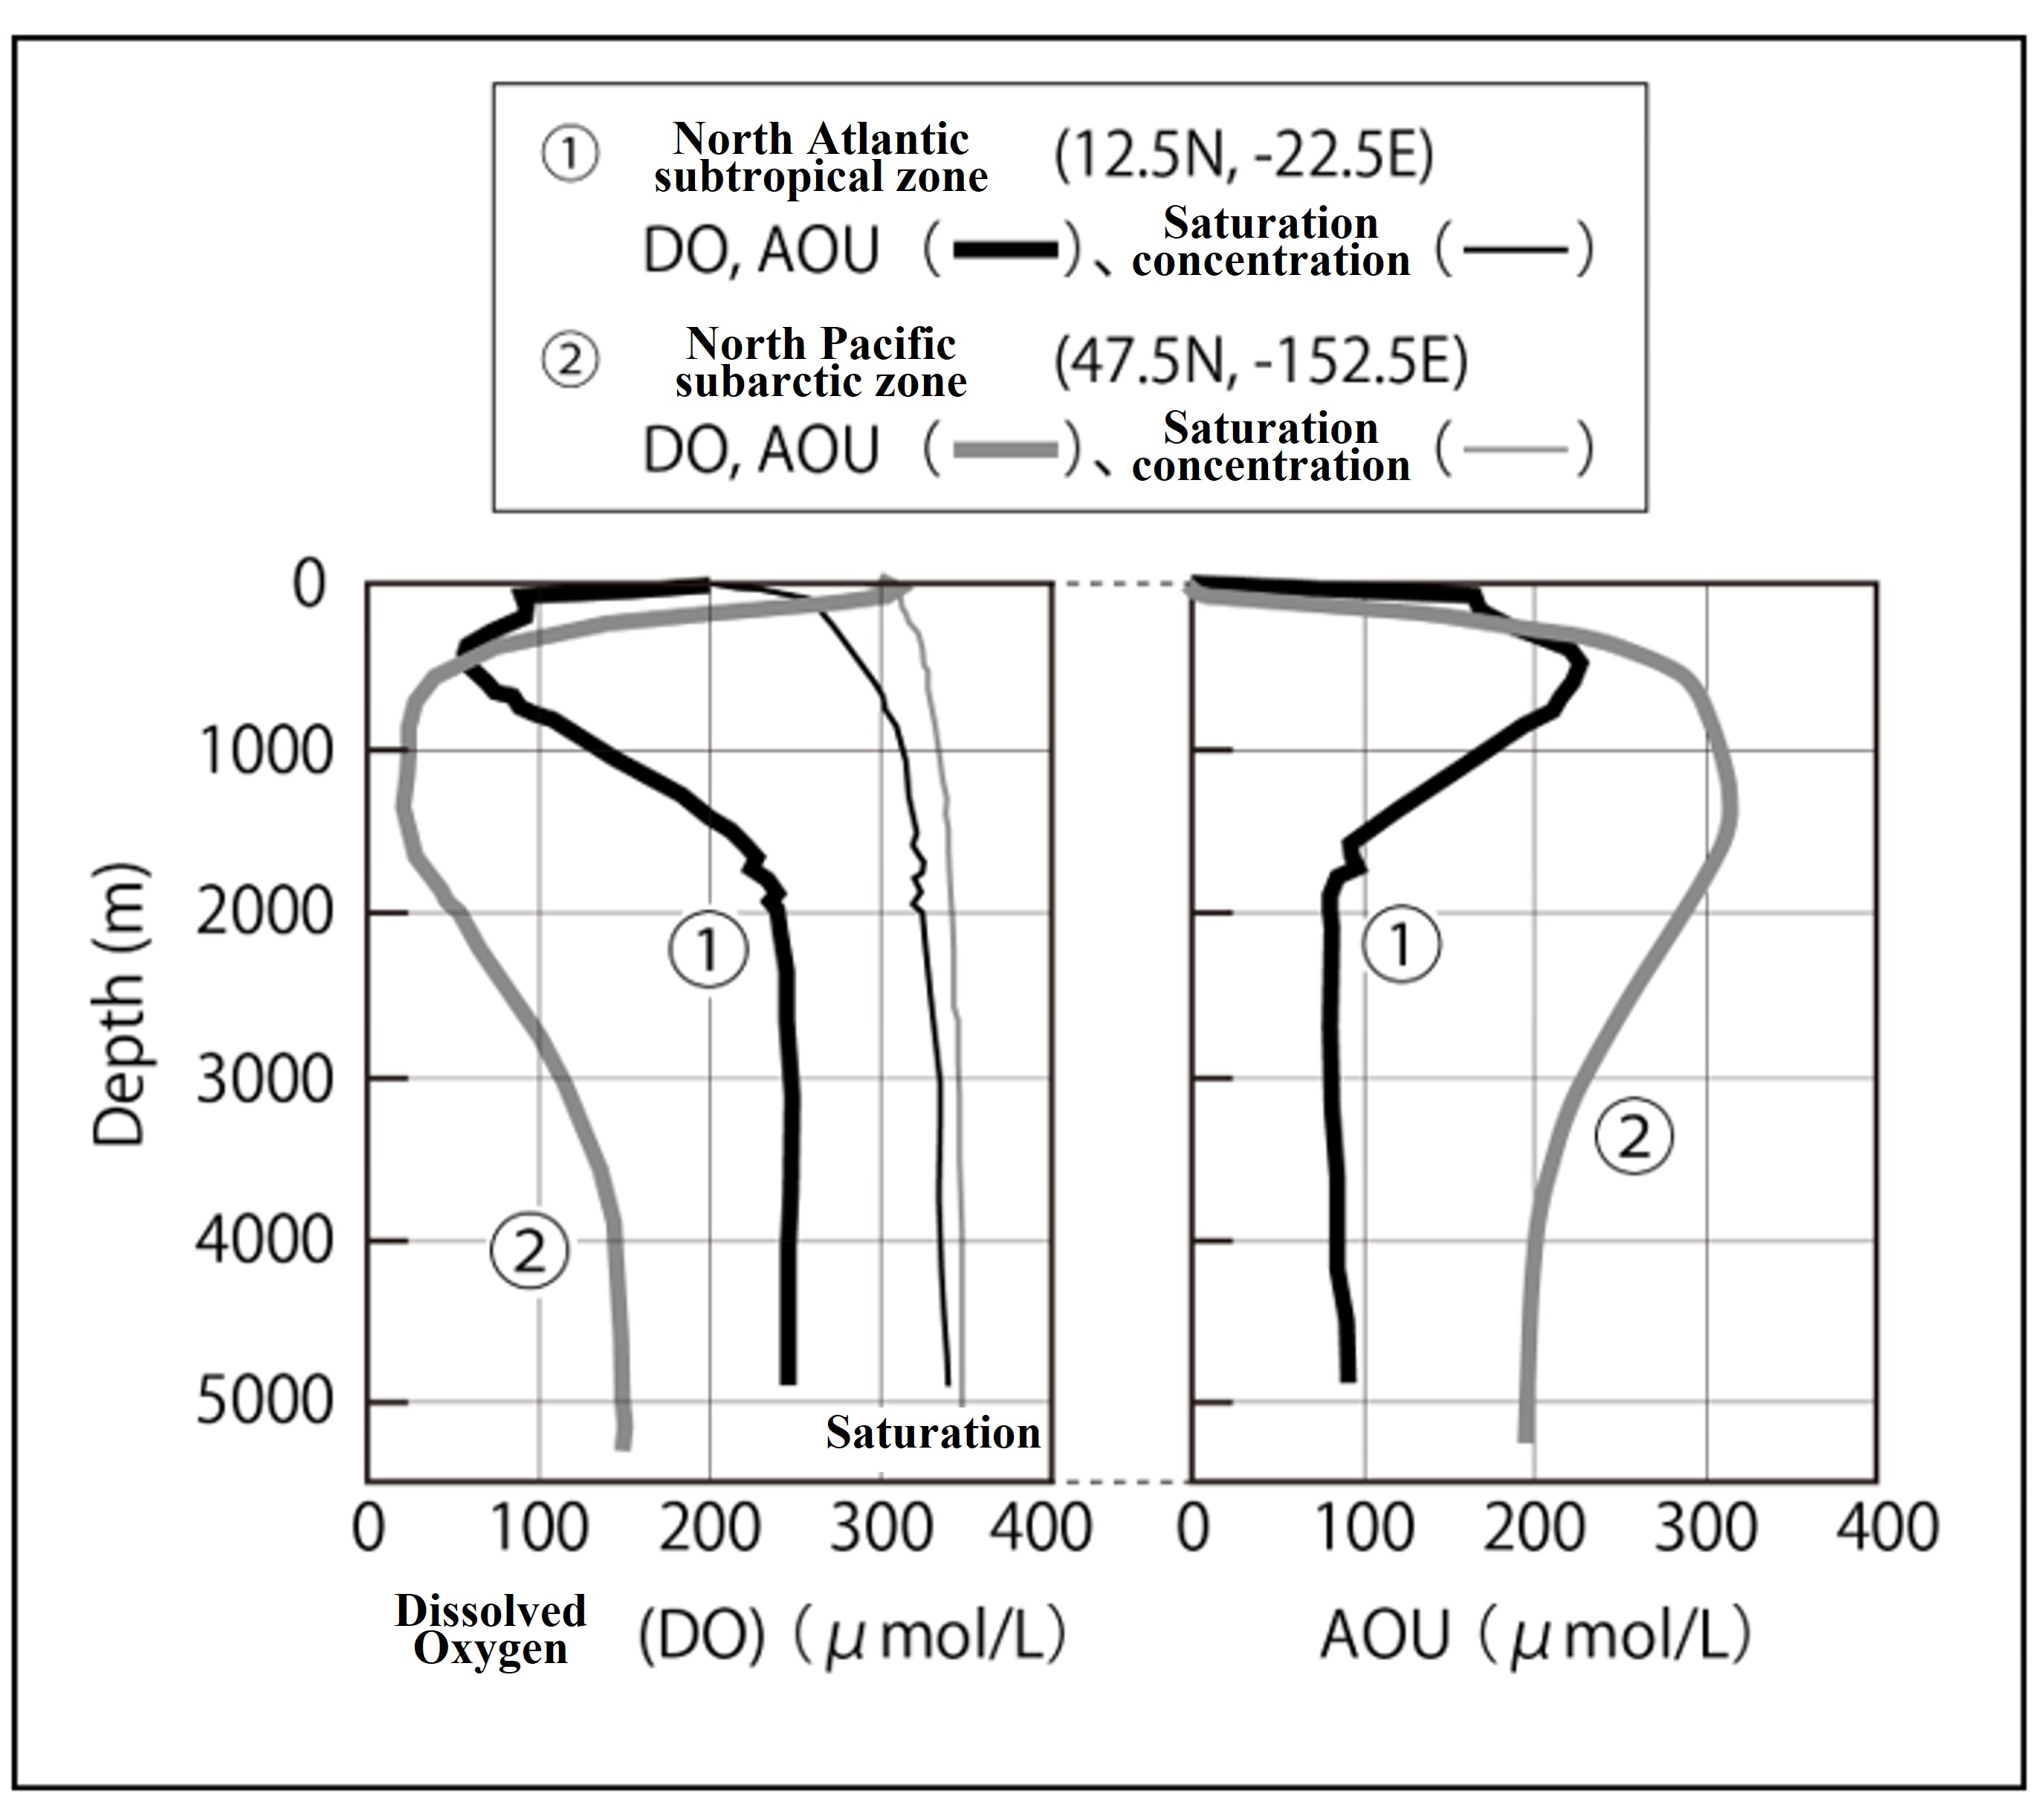
In ocean chemistry, it is standard practice to consider the vertical distribution of each parameter, so let's put the vertical distributions of Dissolved Oxygen (DO) and Apparent Oxygen Utilization (AOU) side by side. Can you answer which graphs ① and ② are North Atlantic or North Pacific?
-