Global Distribution of Dissolved Oxygen
Section outline
-
-
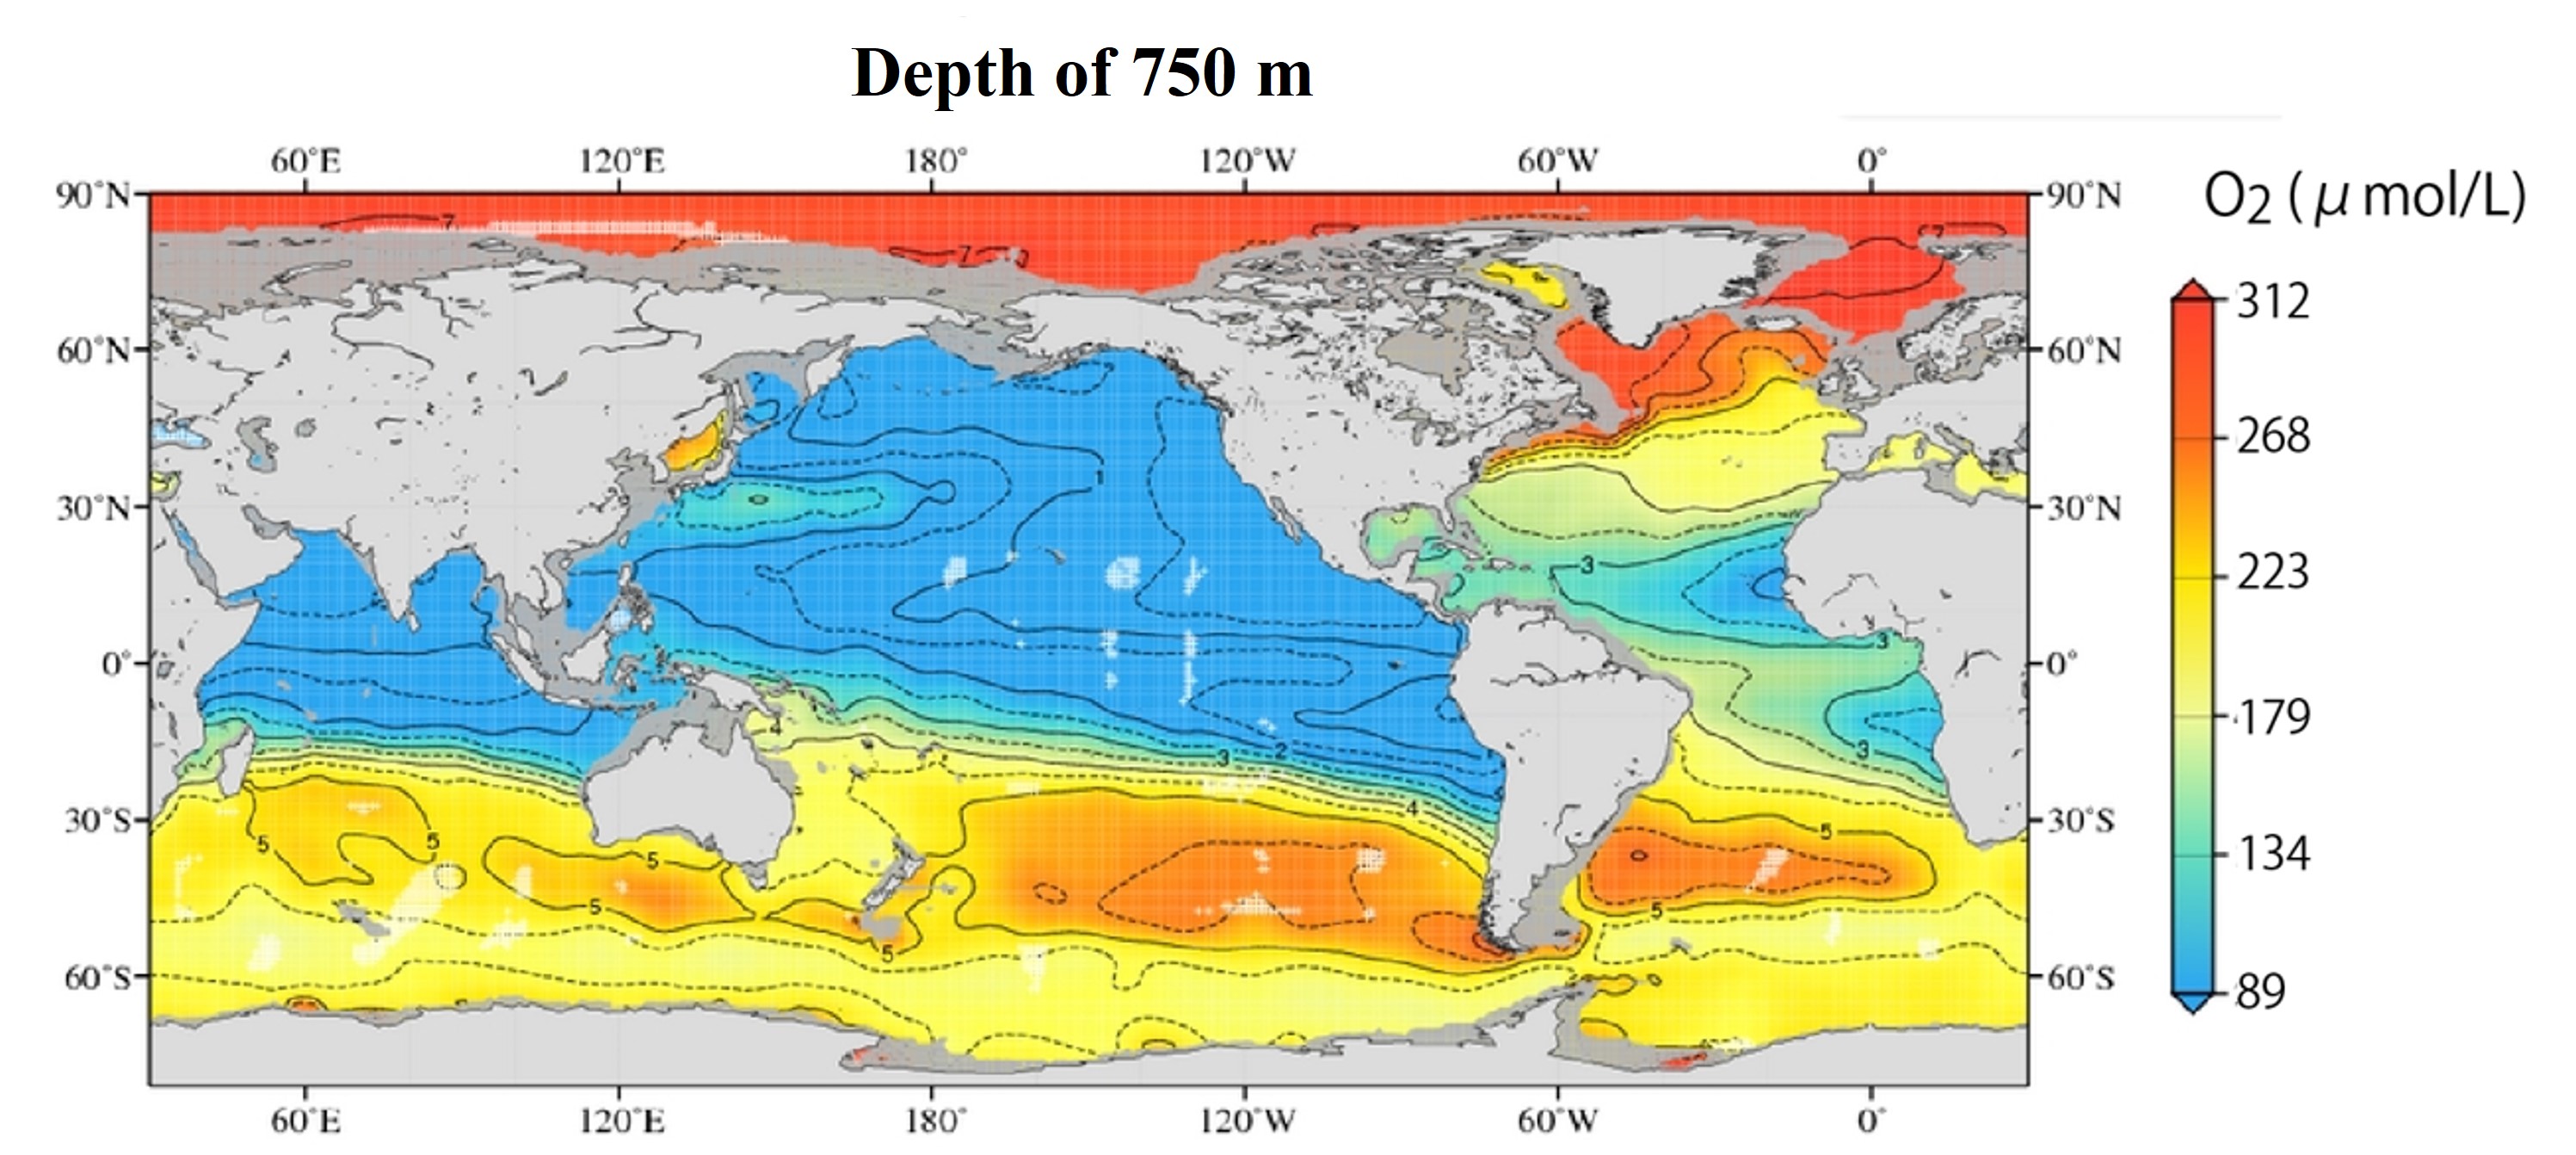
The global distribution of dissolved oxygen concentration at a depth of 750 m, where the oxygen minimum layer is observed, and at a deeper depth of 3000 m.
(Note the different ranges of the color bars in the upper and lower figures.)At a depth of 750 m, oxygen concentrations are lower along the African coast of the Atlantic Ocean. The oxygen concentration is higher in the subtropical Northwest Pacific (around 30°N) than in the surrounding area. Why is this?

-
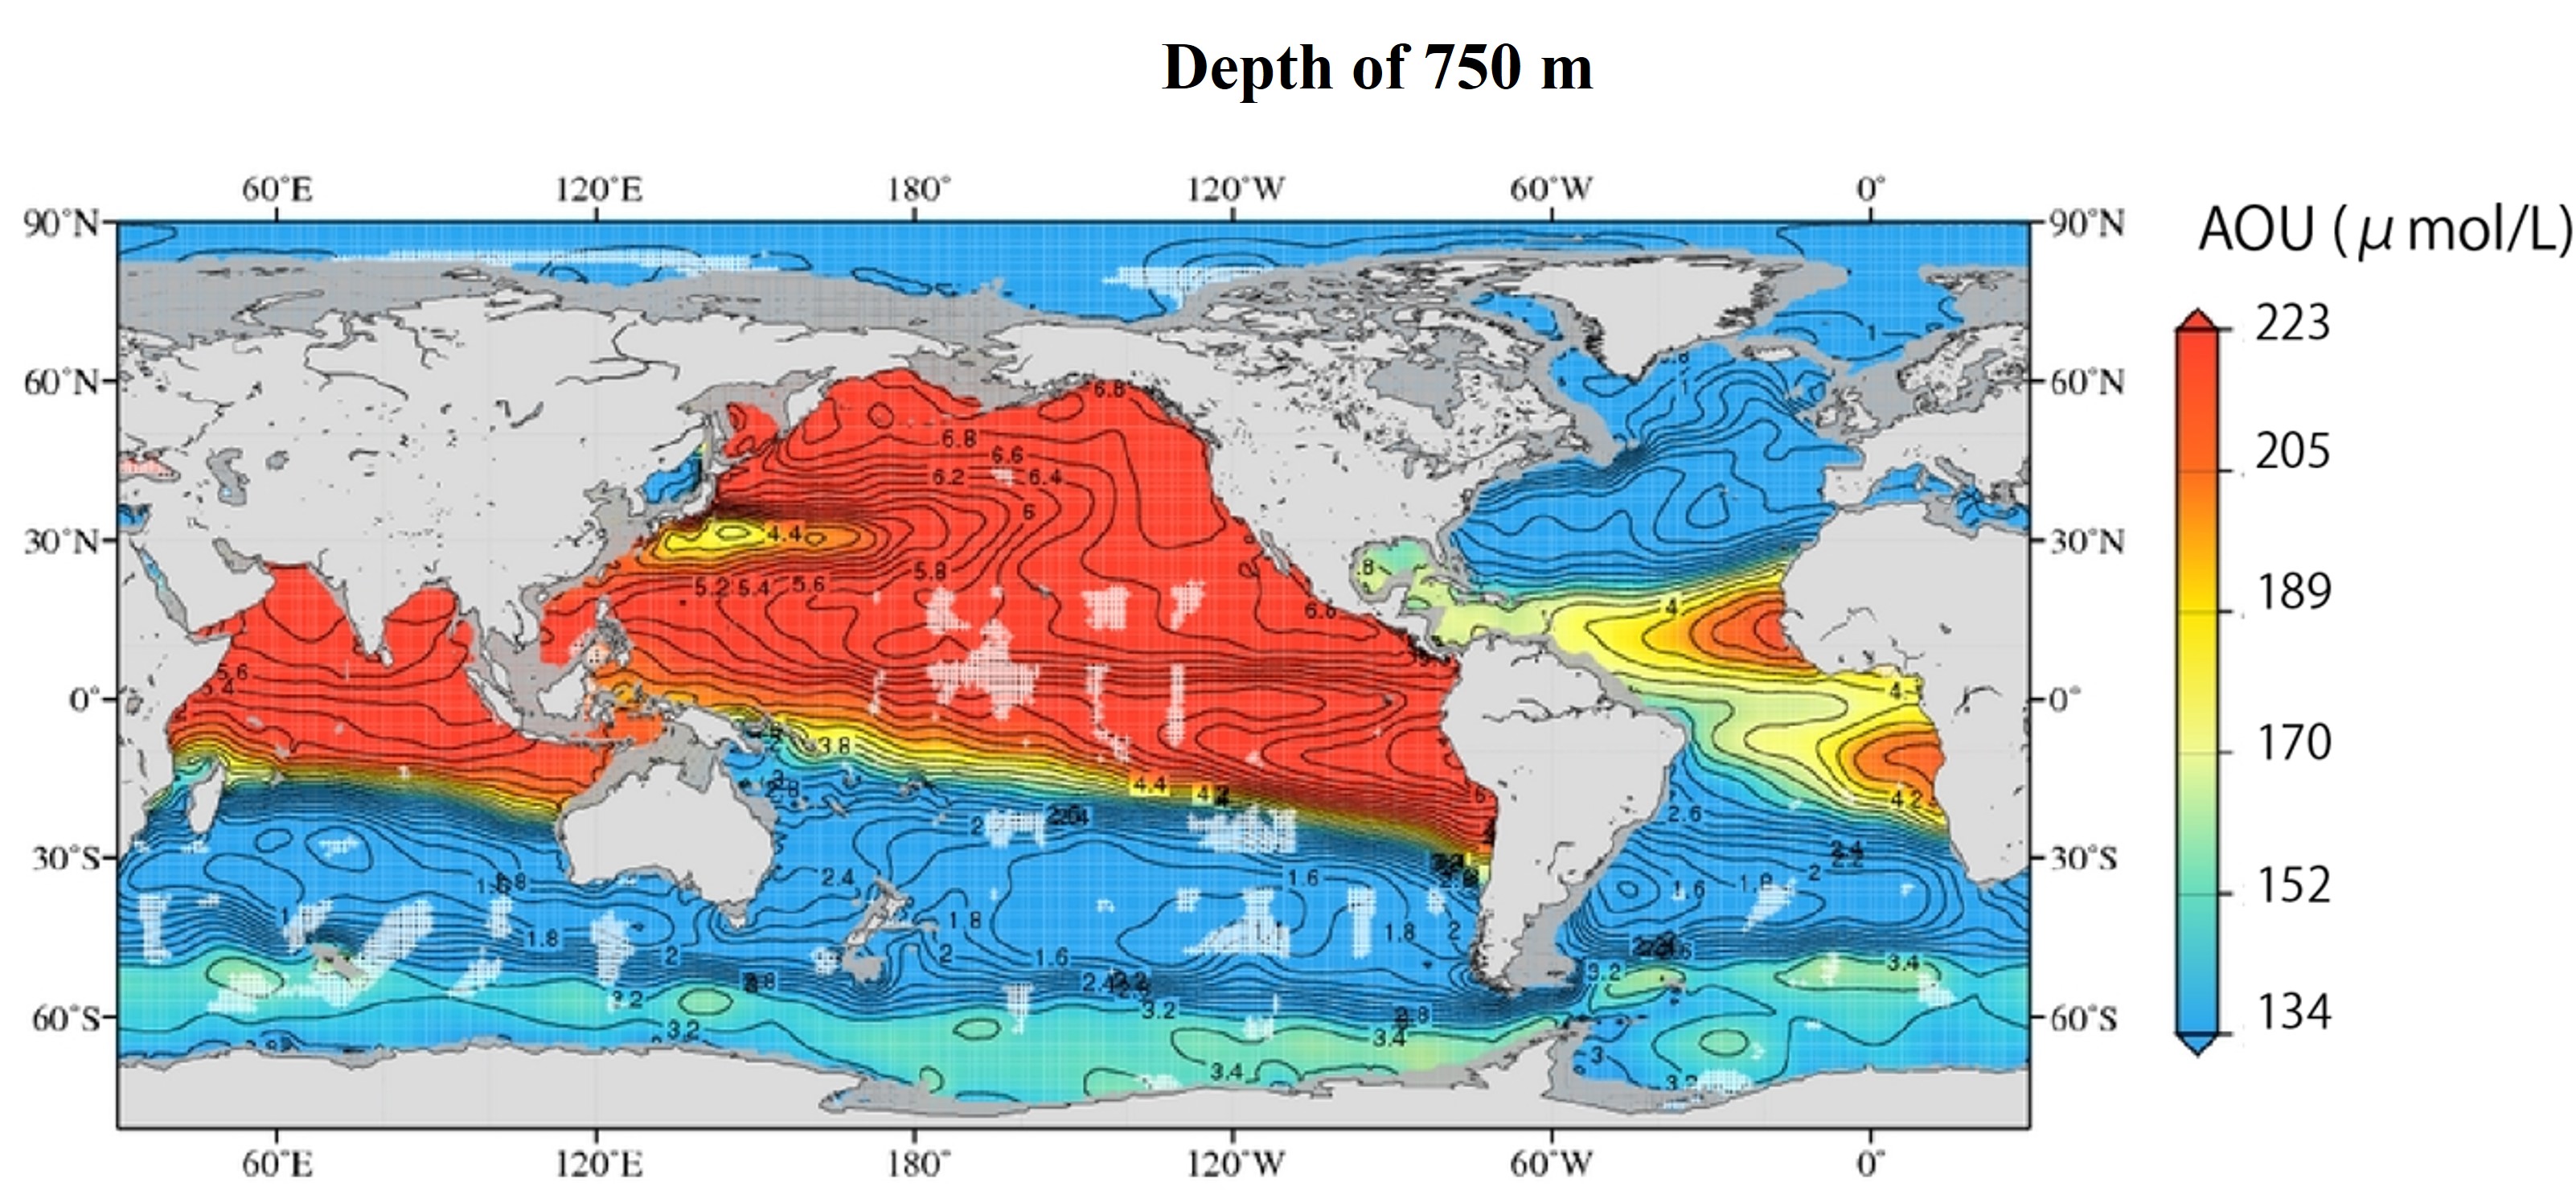
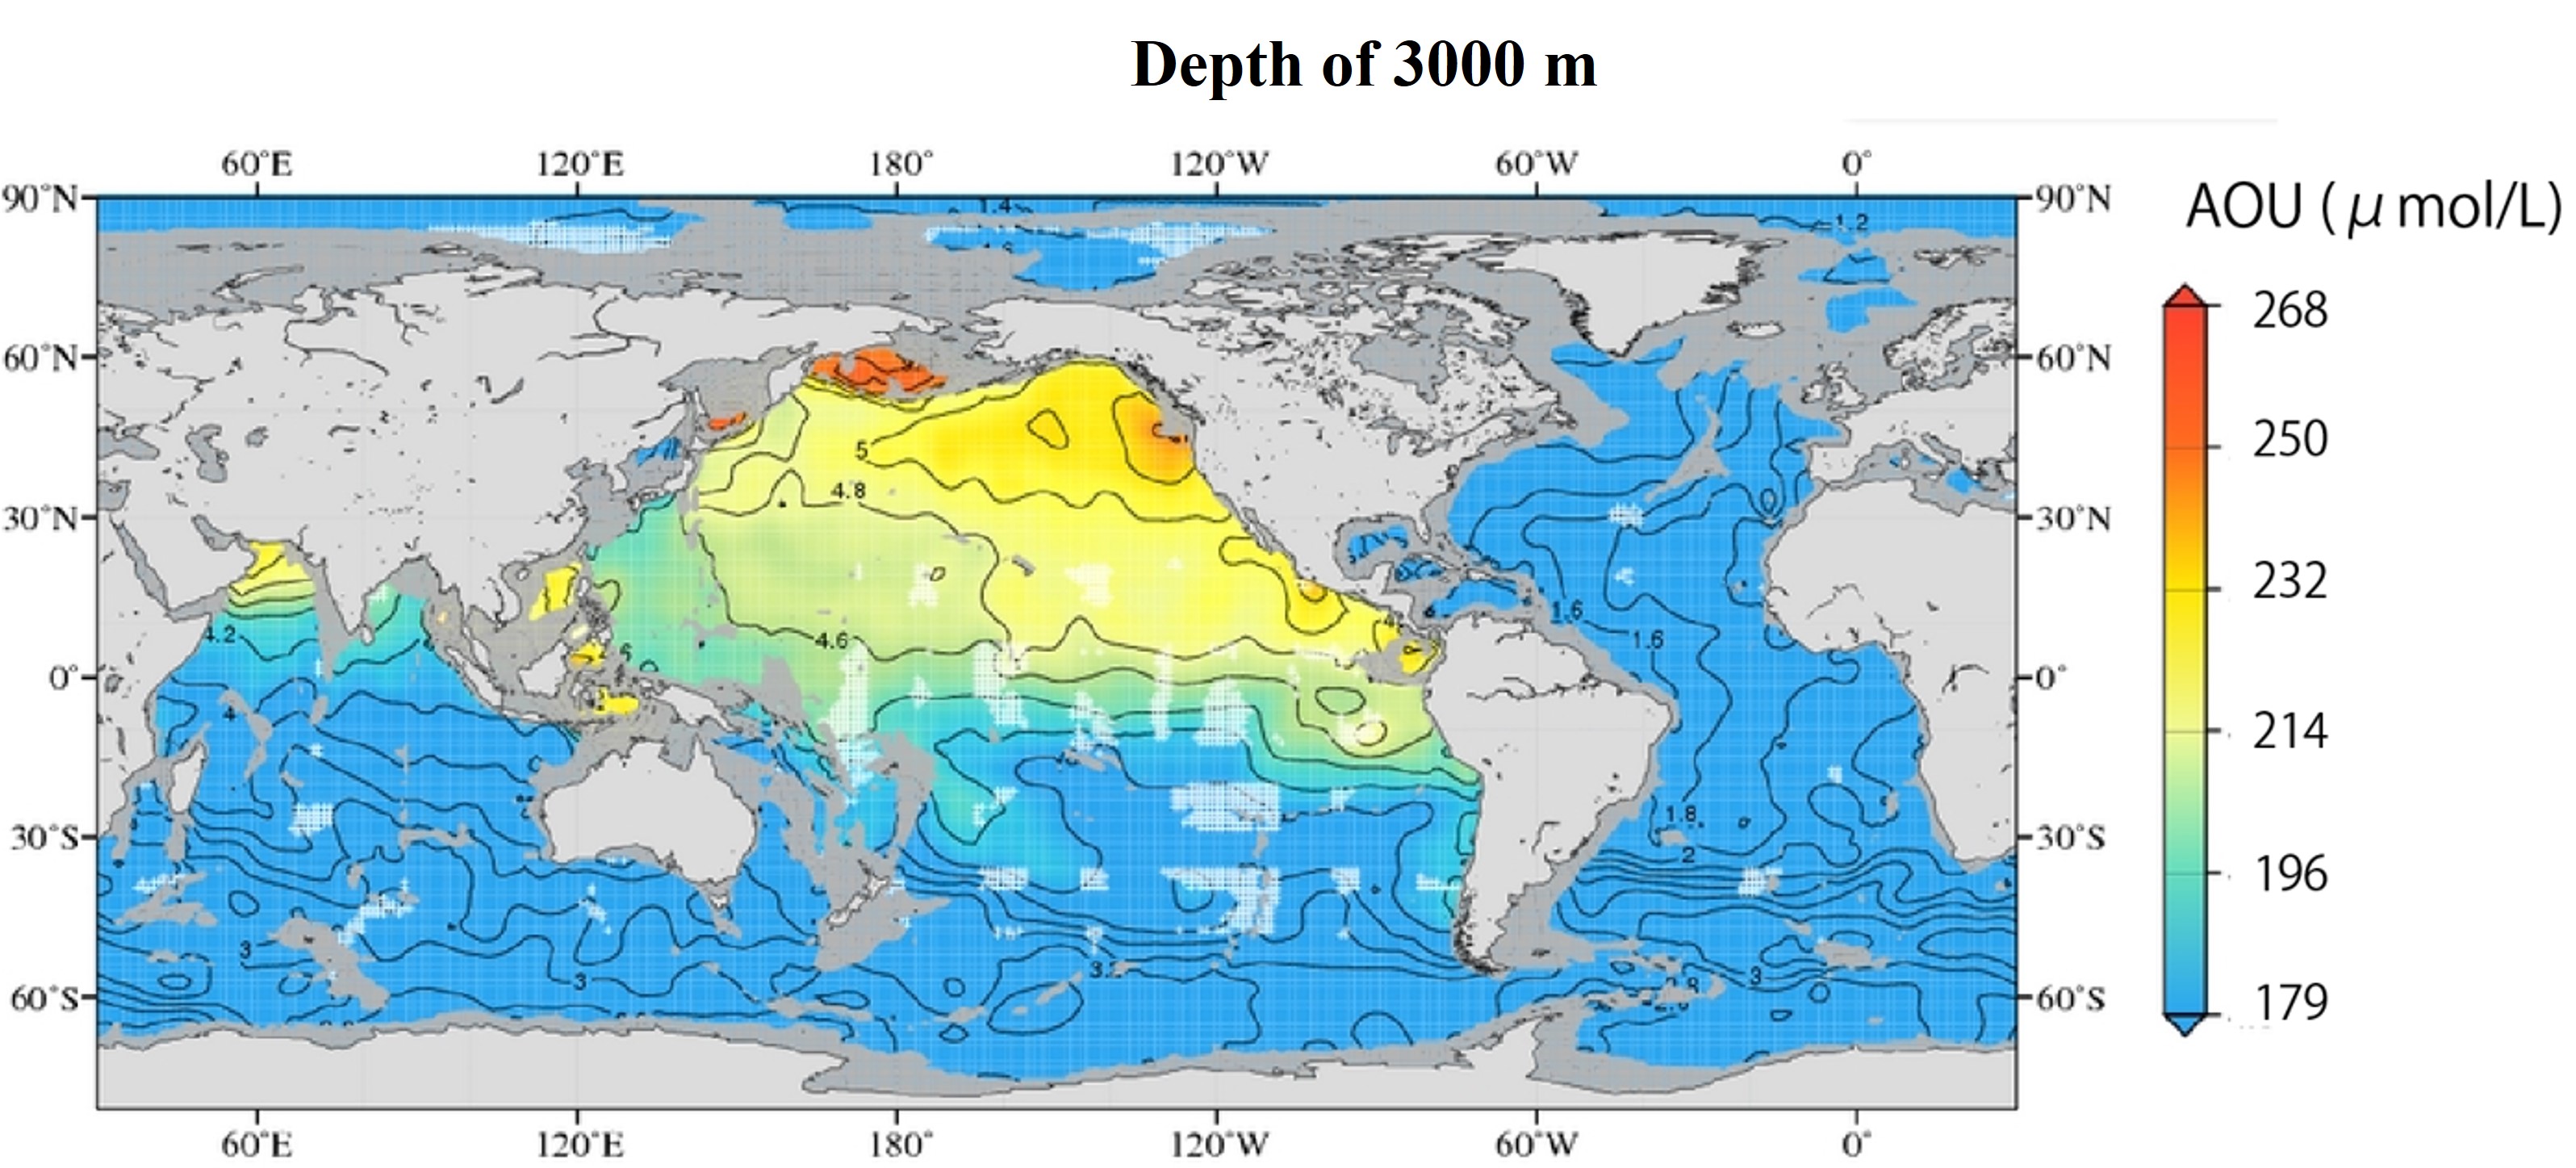
The following is a map of the distribution of Apparent Oxygen Utilization (AOU) at depths of 750 m and 3000 m in the entire ocean. The AOU are approximately inversely related to the global distribution of oxygen concentrations.


-
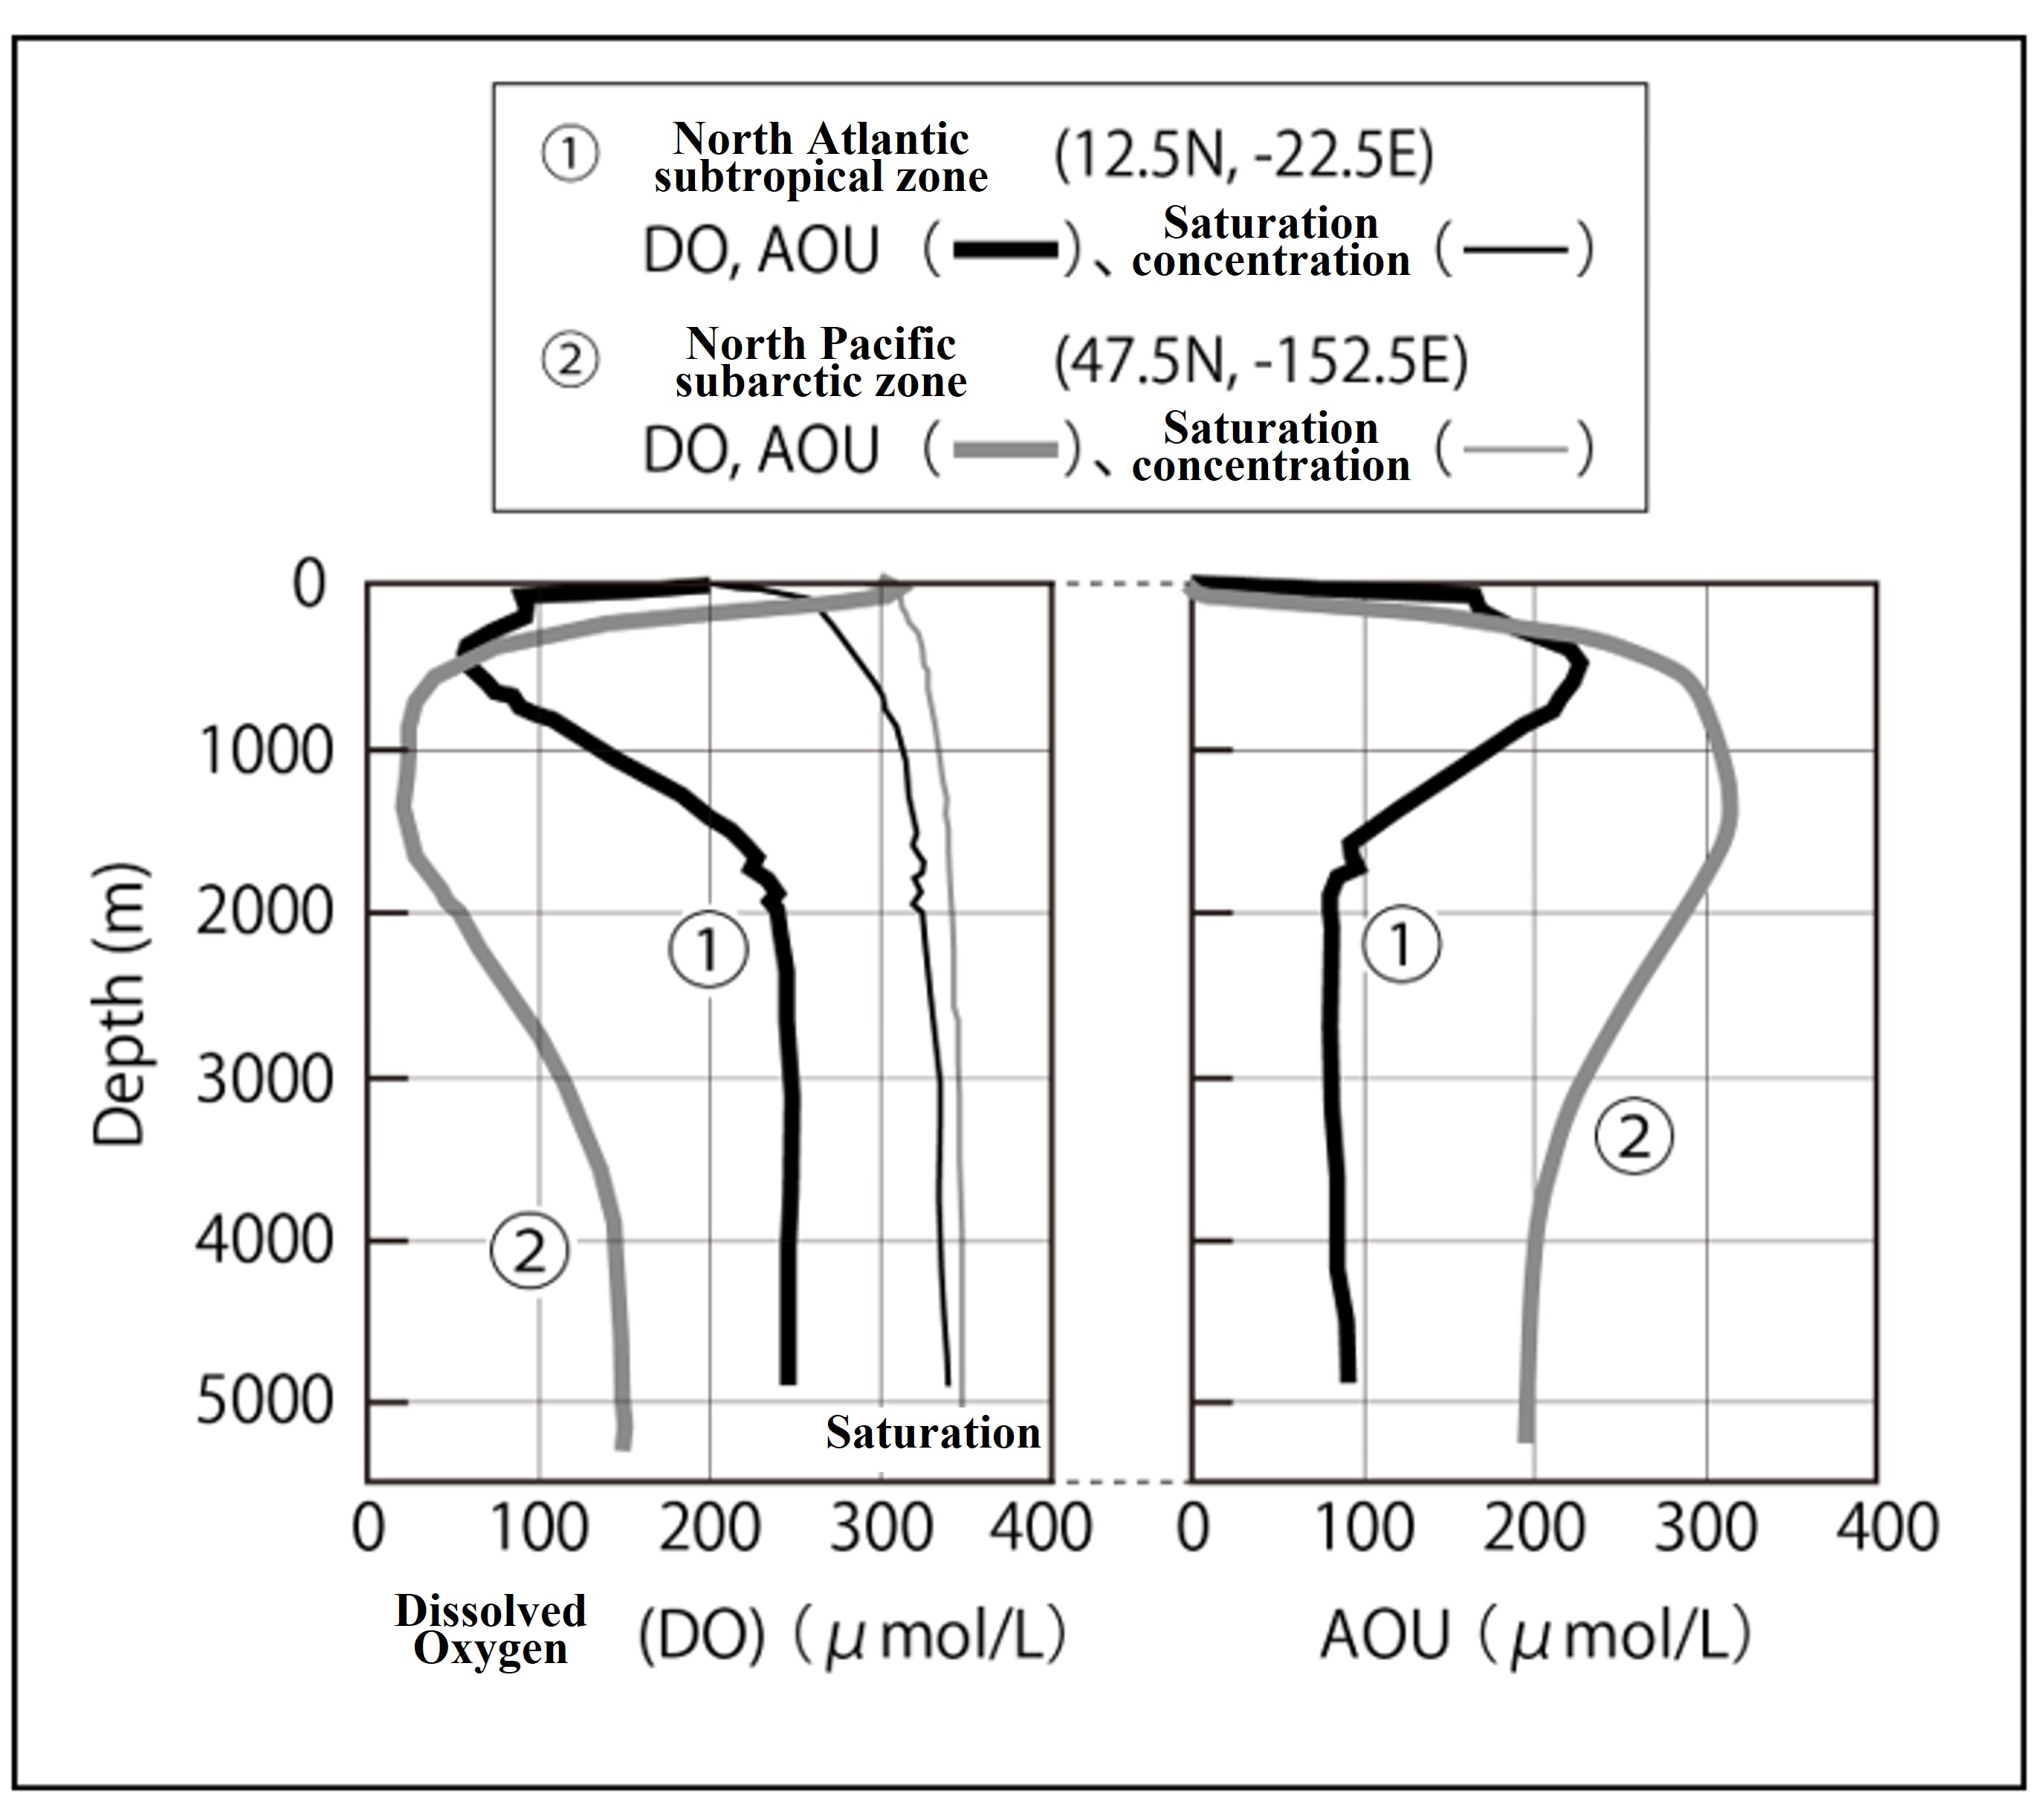
In ocean chemistry, it is standard practice to consider the vertical distribution of each parameter, so let's put the vertical distributions of Dissolved Oxygen (DO) and Apparent Oxygen Utilization (AOU) side by side. Can you answer which graphs ① and ② are North Atlantic or North Pacific?


