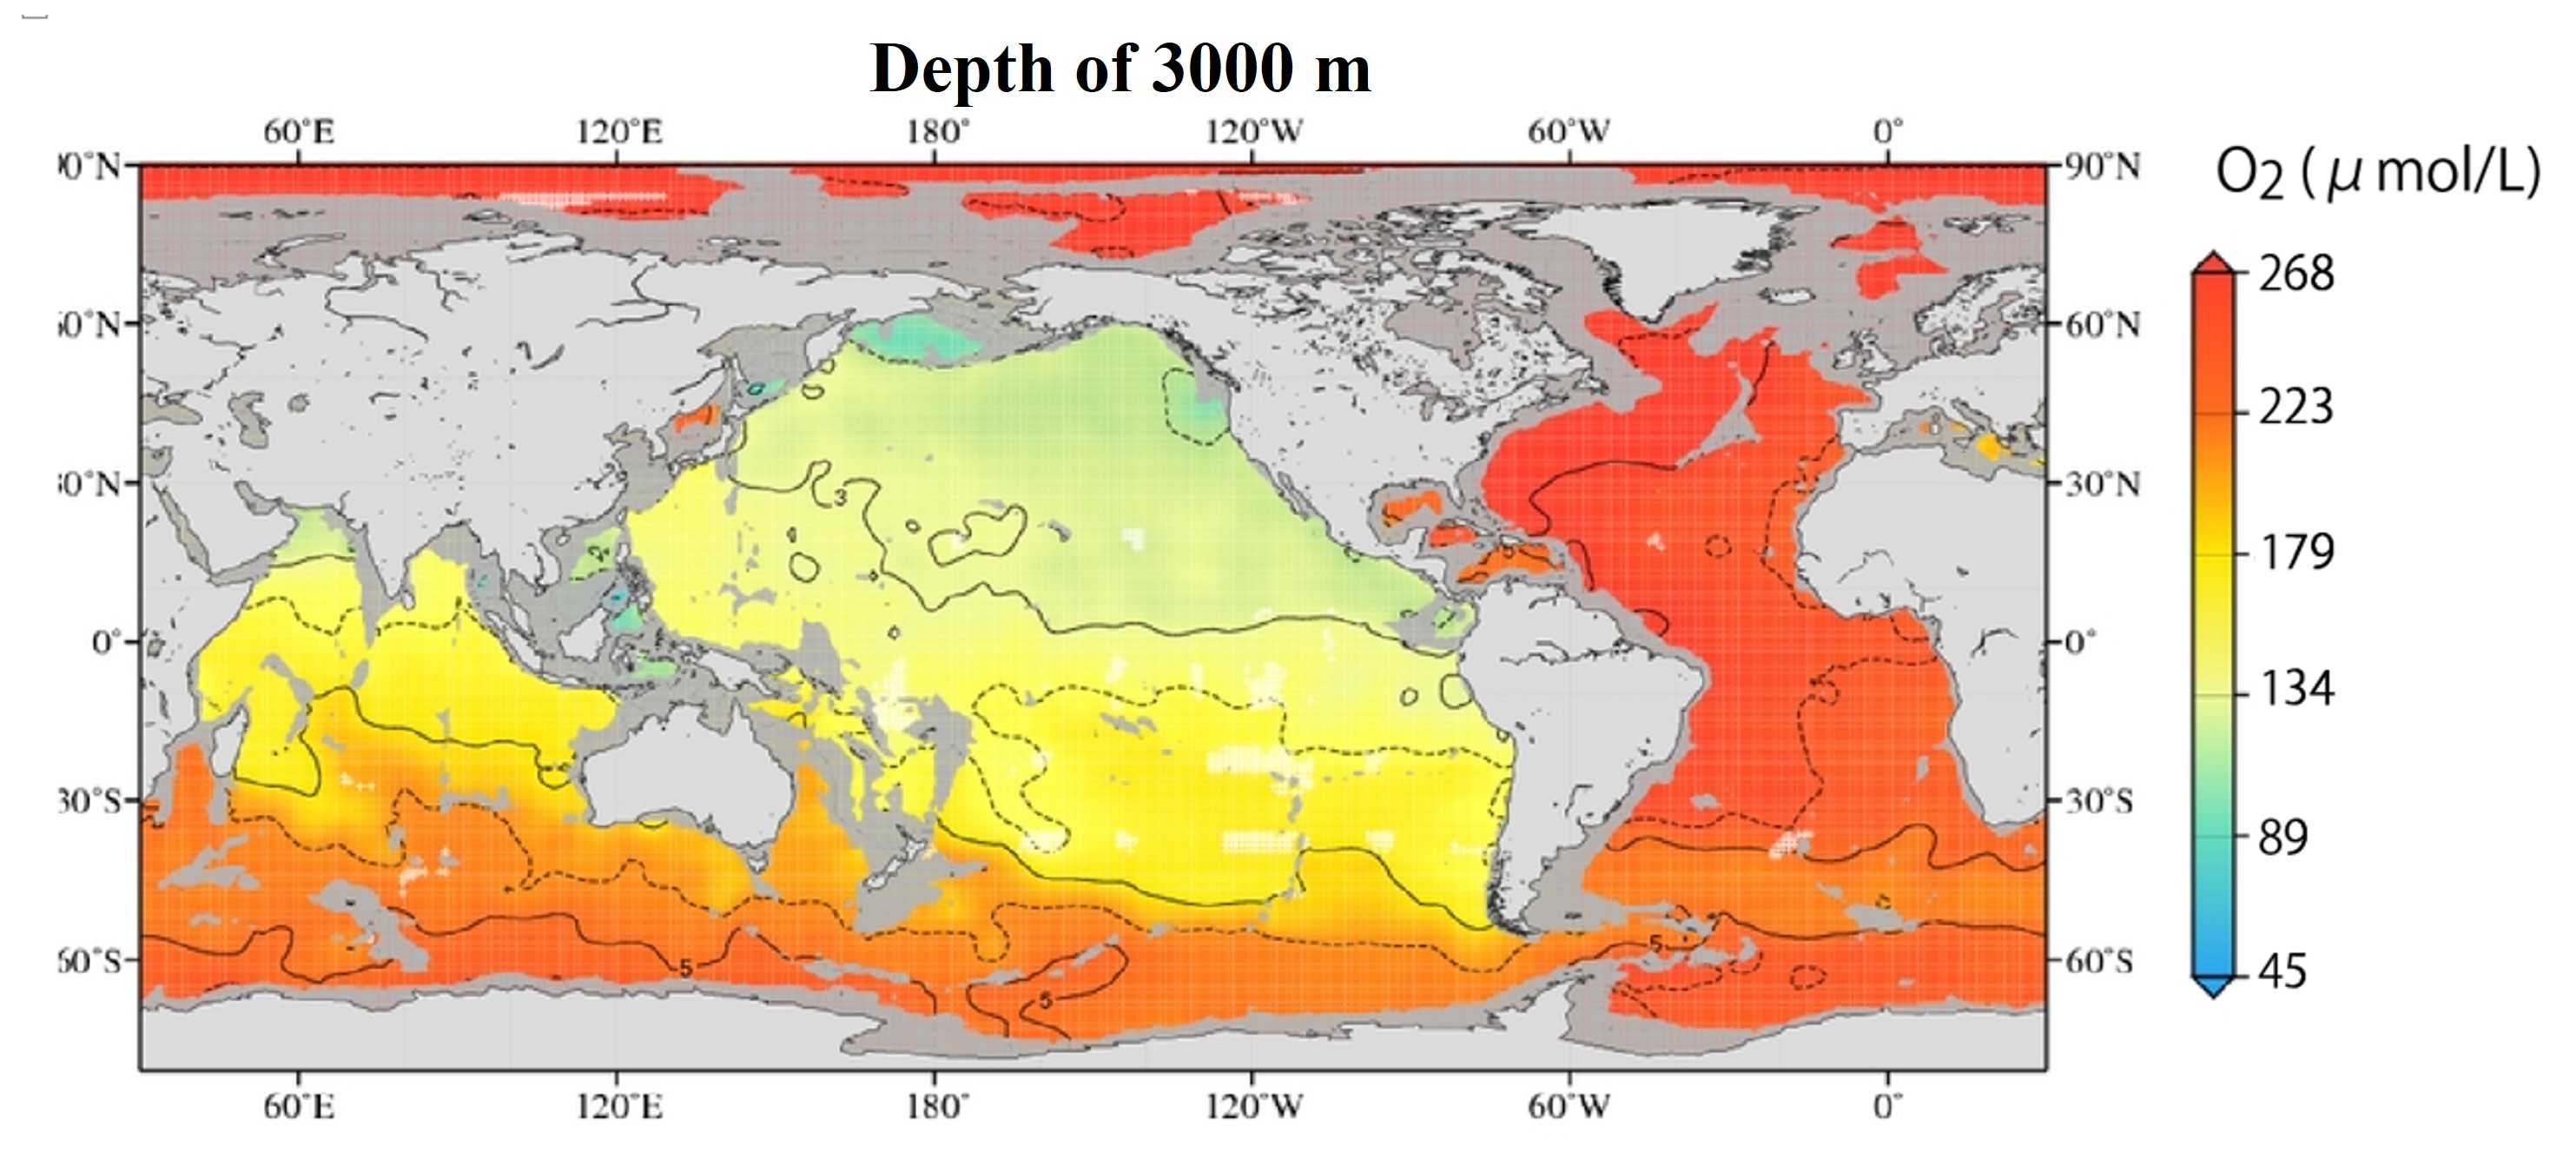
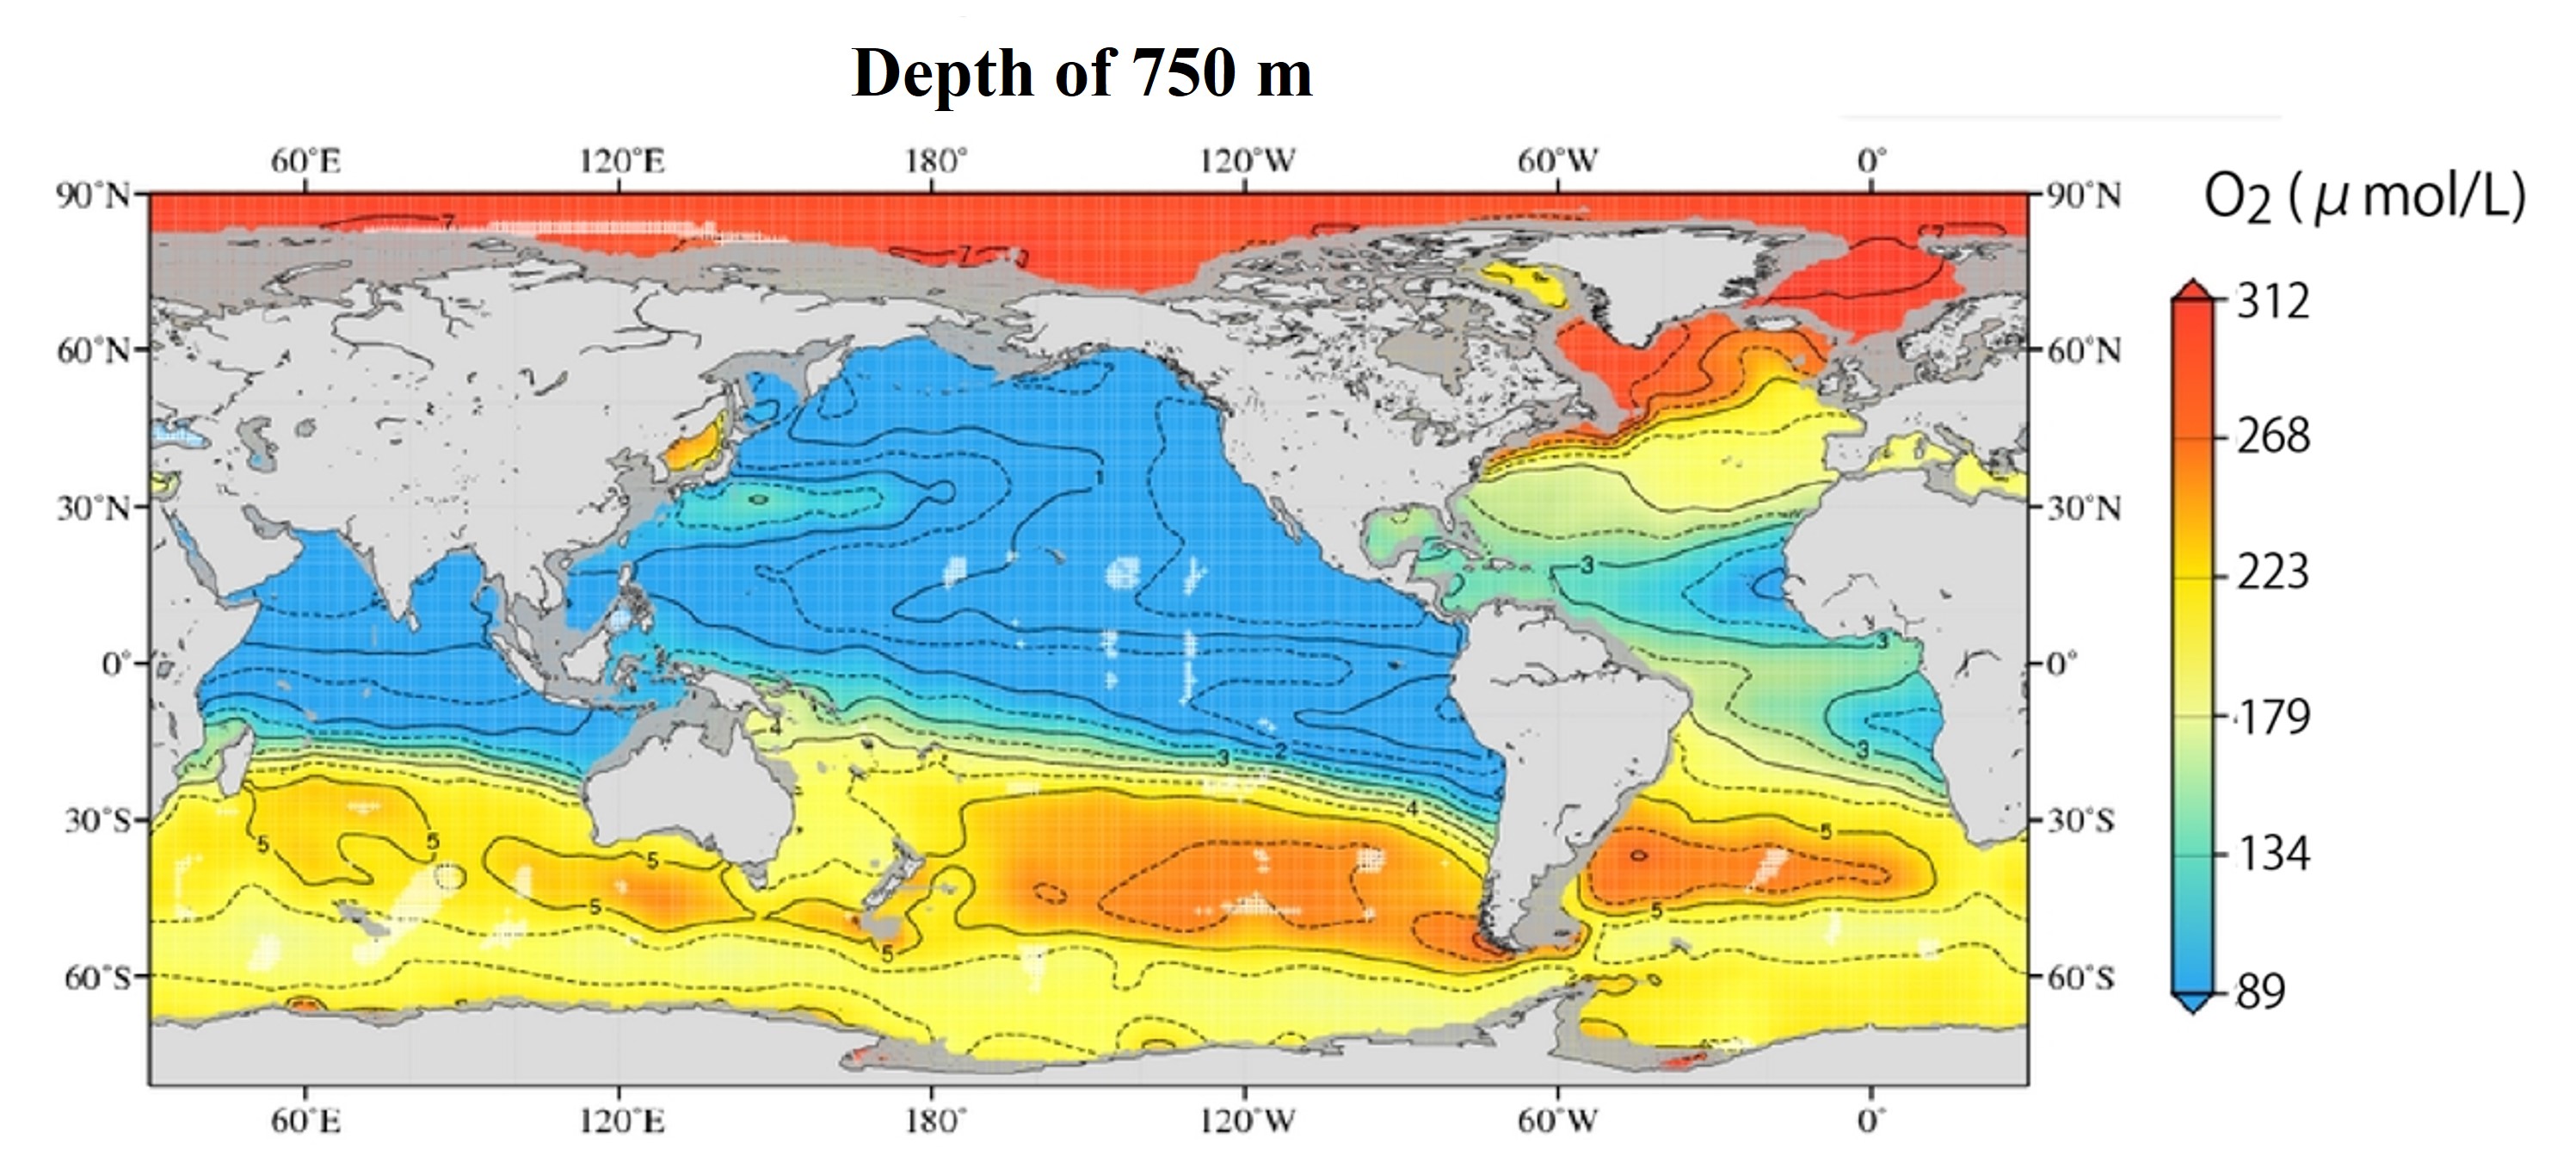
Oxygen concentration: pycnocline (750 m) and deep layer (3000 m) (←Click here)
(Note the different ranges of the color bars in the upper and lower figures.
Focusing on the depth of 750 m, the mid-latitude region of the Eastern Atlantic (the Atlantic coast of Africa) has a lower concentration of oxygen than the average oxygen concentration in the surrounding Atlantic. Adistinct oxygen minimum layer appears at a depth of 750 m in this area. This may be due to the sinking of organic matter produced in the surface layer in situ (mid-latitudes region of the North Atlantic) and the consumption of oxygen in the pycnocline.
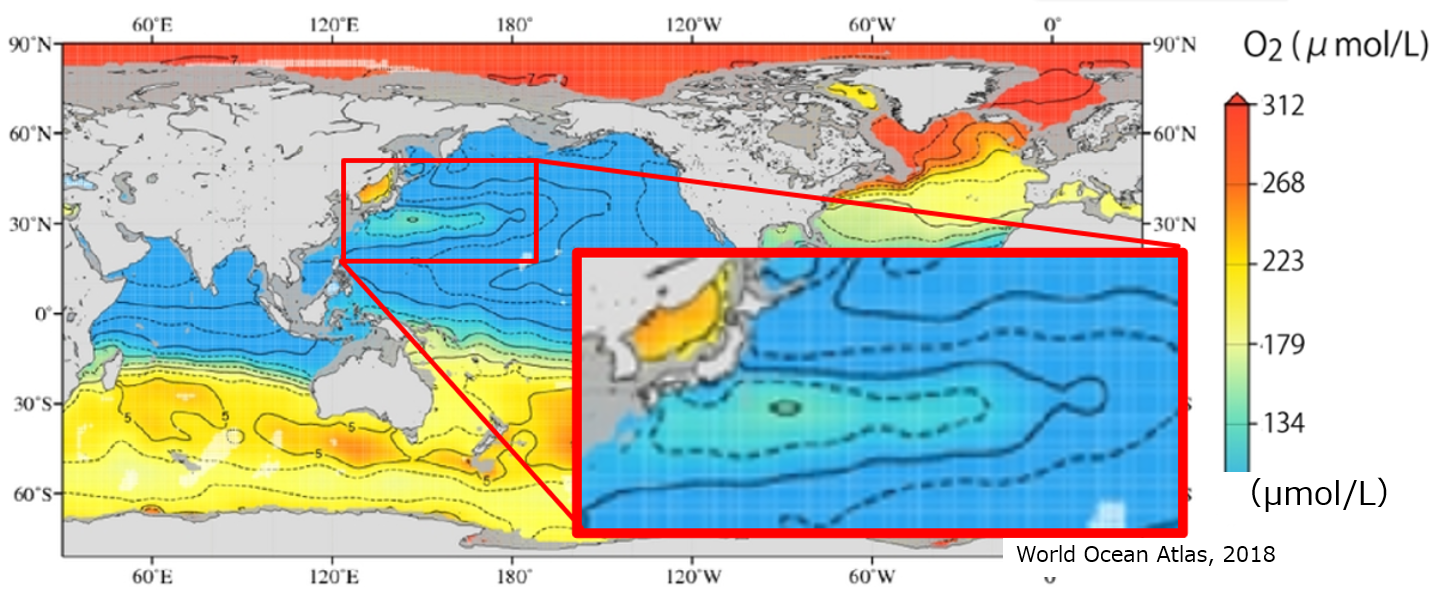
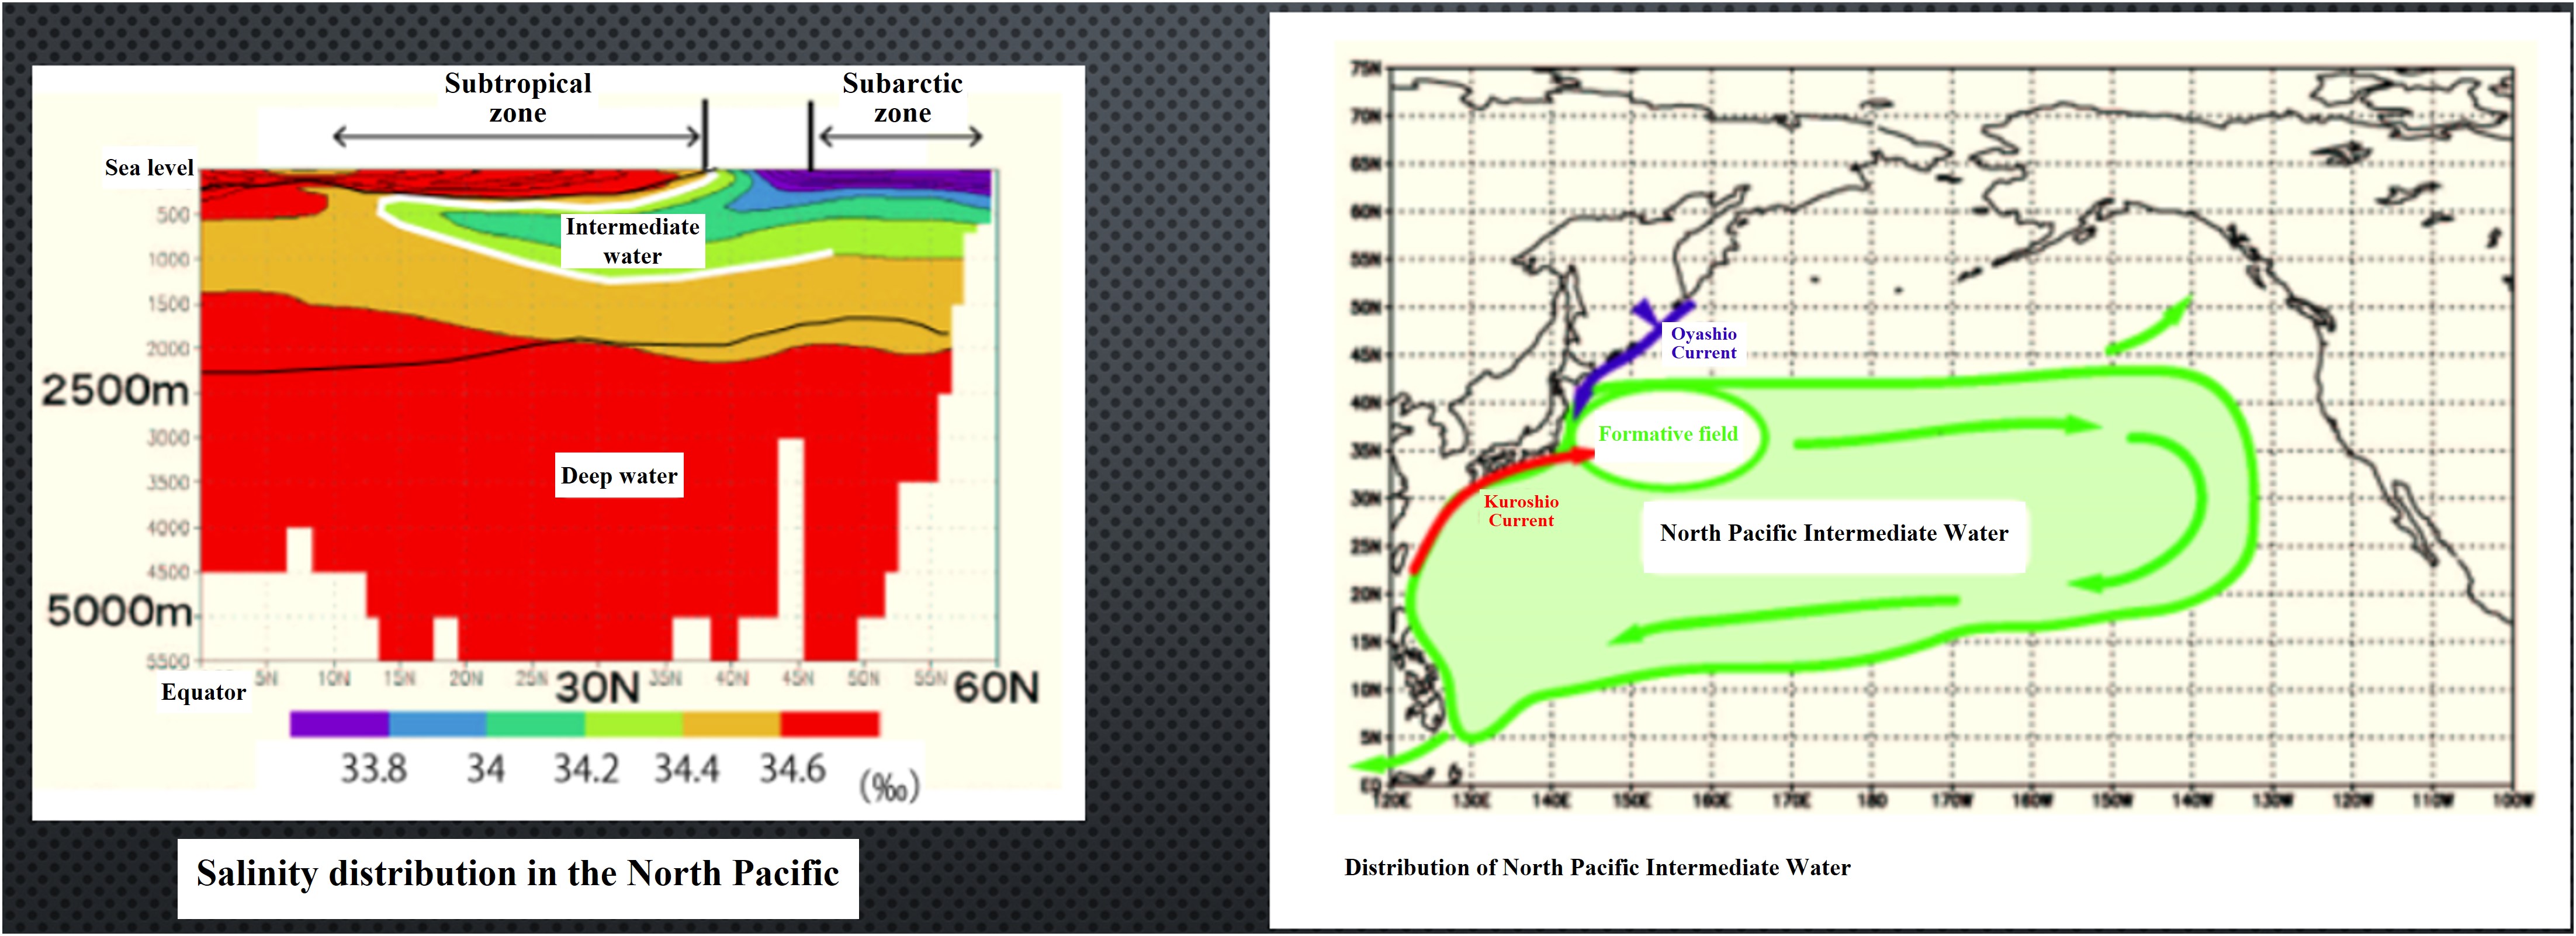
On the other hand, in the subtropical region south of the Japanese Islands in the northwestern Pacific Ocean (around 30°N), oxygen concentrations are higher than in the surrounding Pacific Ocean. (Look carefully and find the light yellow-colored area in the Pacific Ocean near the Japanese Islands. ). This is thought to be due to the fact that in that northern area (the area off the Touhoku coast), the surface water sinks due to winter cooling and spreads into the middle layer, including the 750 m depth area. Because of its proximity to the sinking area, high oxygen concentrations are maintained in the middle water. Although this middle water is spread throughout the subtropical area, after a long time has passed since subduction, the oxygen concentration decreases due to organic matter decomposition. Therefore, the oxygen concentration is not elevated in the middle layer throughout the subtropical North Pacific, but is limited to the area near the Japanese Islands.