AOU: Pycnocline (750 m) and deep layer (3000 m) (←Click here)
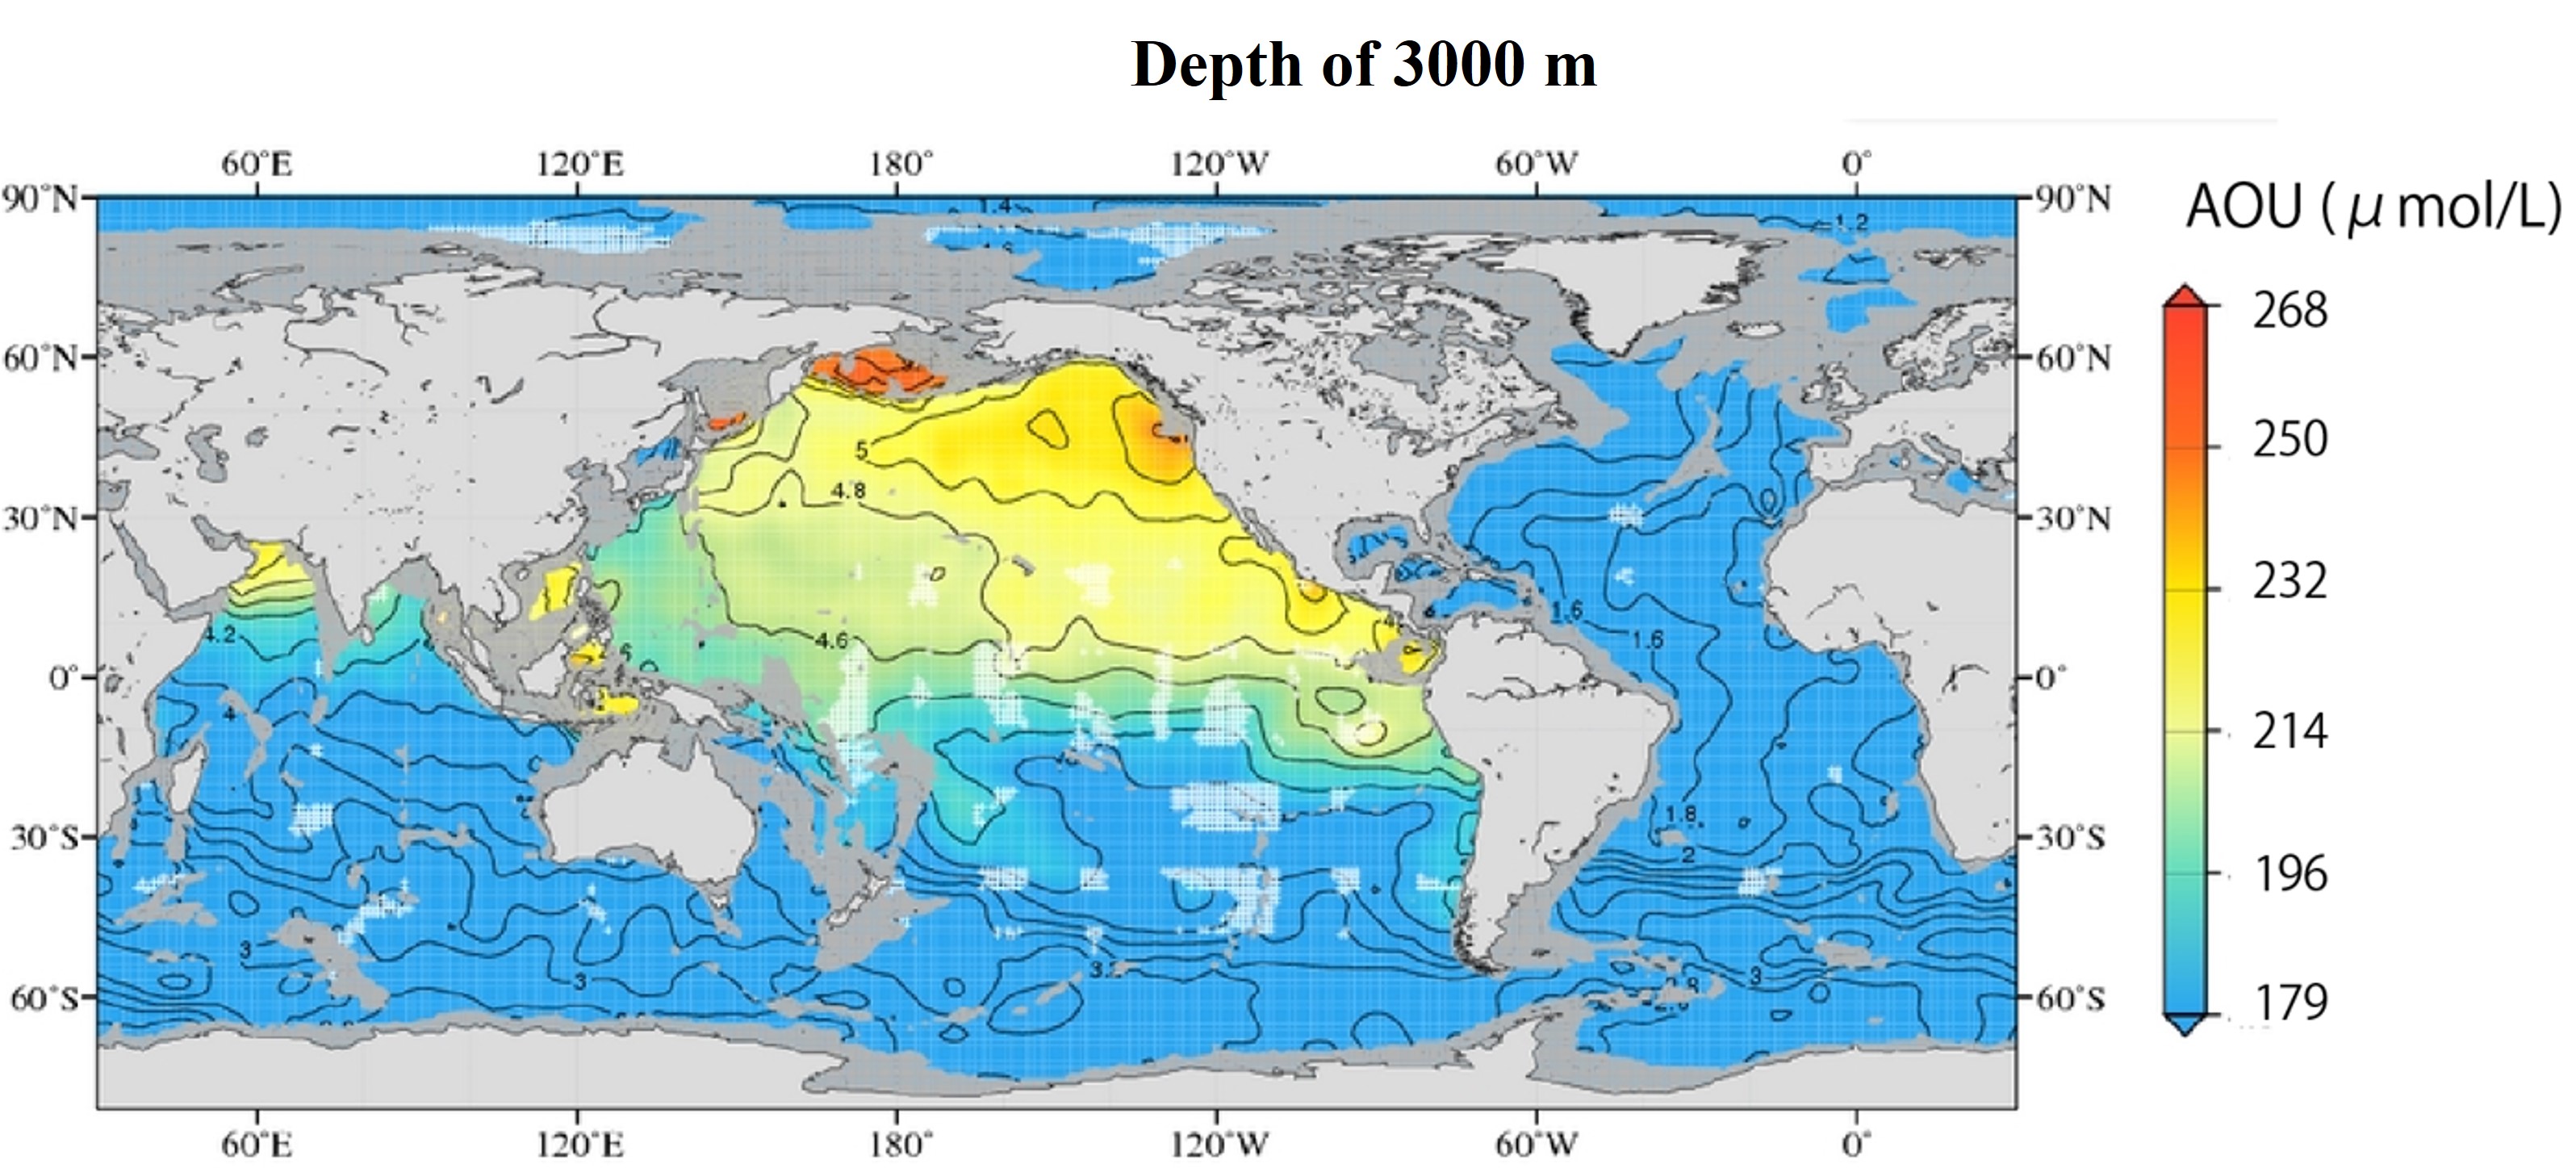
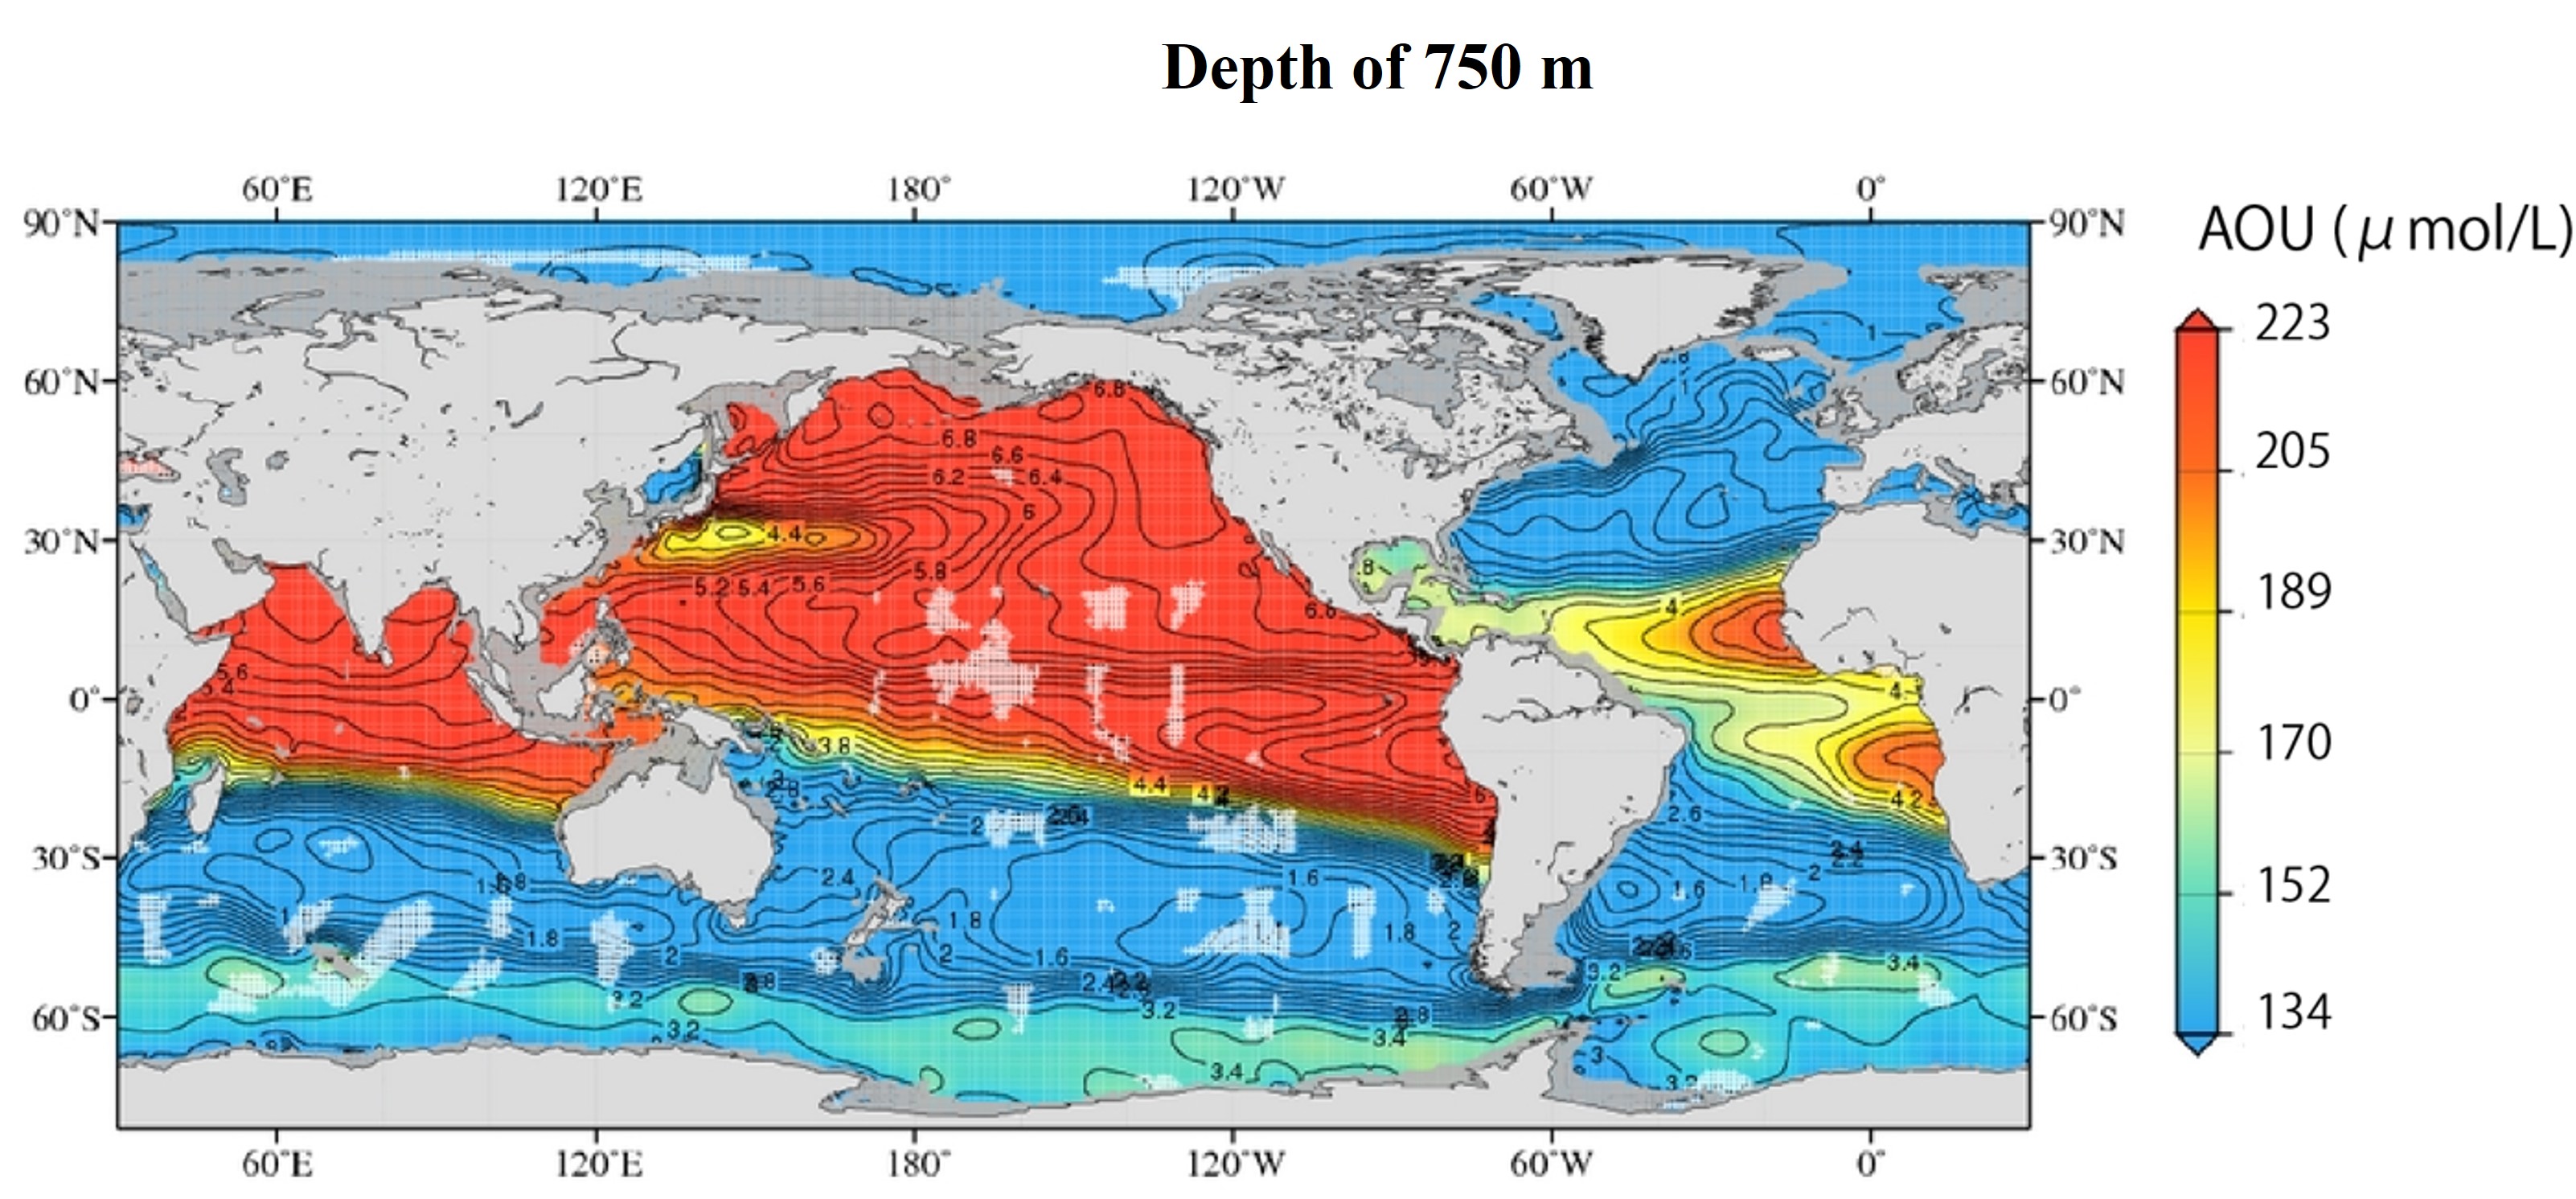
The following is a map of the distribution of Apparent Oxygen Utility (AOU) at depths of 750 m and 3000 m in the entire ocean. The AOU are approximately inversely related to the global distribution of oxygen concentrations.
In the pycnocline (750m), it is important to note that the AOU is larger in the mid-latitudes of the East Atlantic compared to the surrounding area, and that the AOU is smaller in the south of the Japanese Islands in the Northwest Pacific. (The reason for this is explained in the global distribution of oxygen section.). A slightly higher AOU is also observed in the Southern Ocean. This may be due to the high AOU water in the deep layer being brought to a depth of 750 m by vertical mixing. (This is speculation at this time.)
Looking at the AOU distribution in deep water (3000m), the North Pacific high latitude region at the end of the deep circulation has a large AOU. It has an inverse relationship with the distribution of oxygen concentration. In particular, the AOU of the northern Bering Sea is the highest among all the oceans in the world. It may simply be due to the fact that the oldest water is upwelling in the northern Bering Sea, or in addition, organic matter produced in the surface layer of that area is transported to the deep layer, causing organic matter decomposition and promoting oxygen consumption.