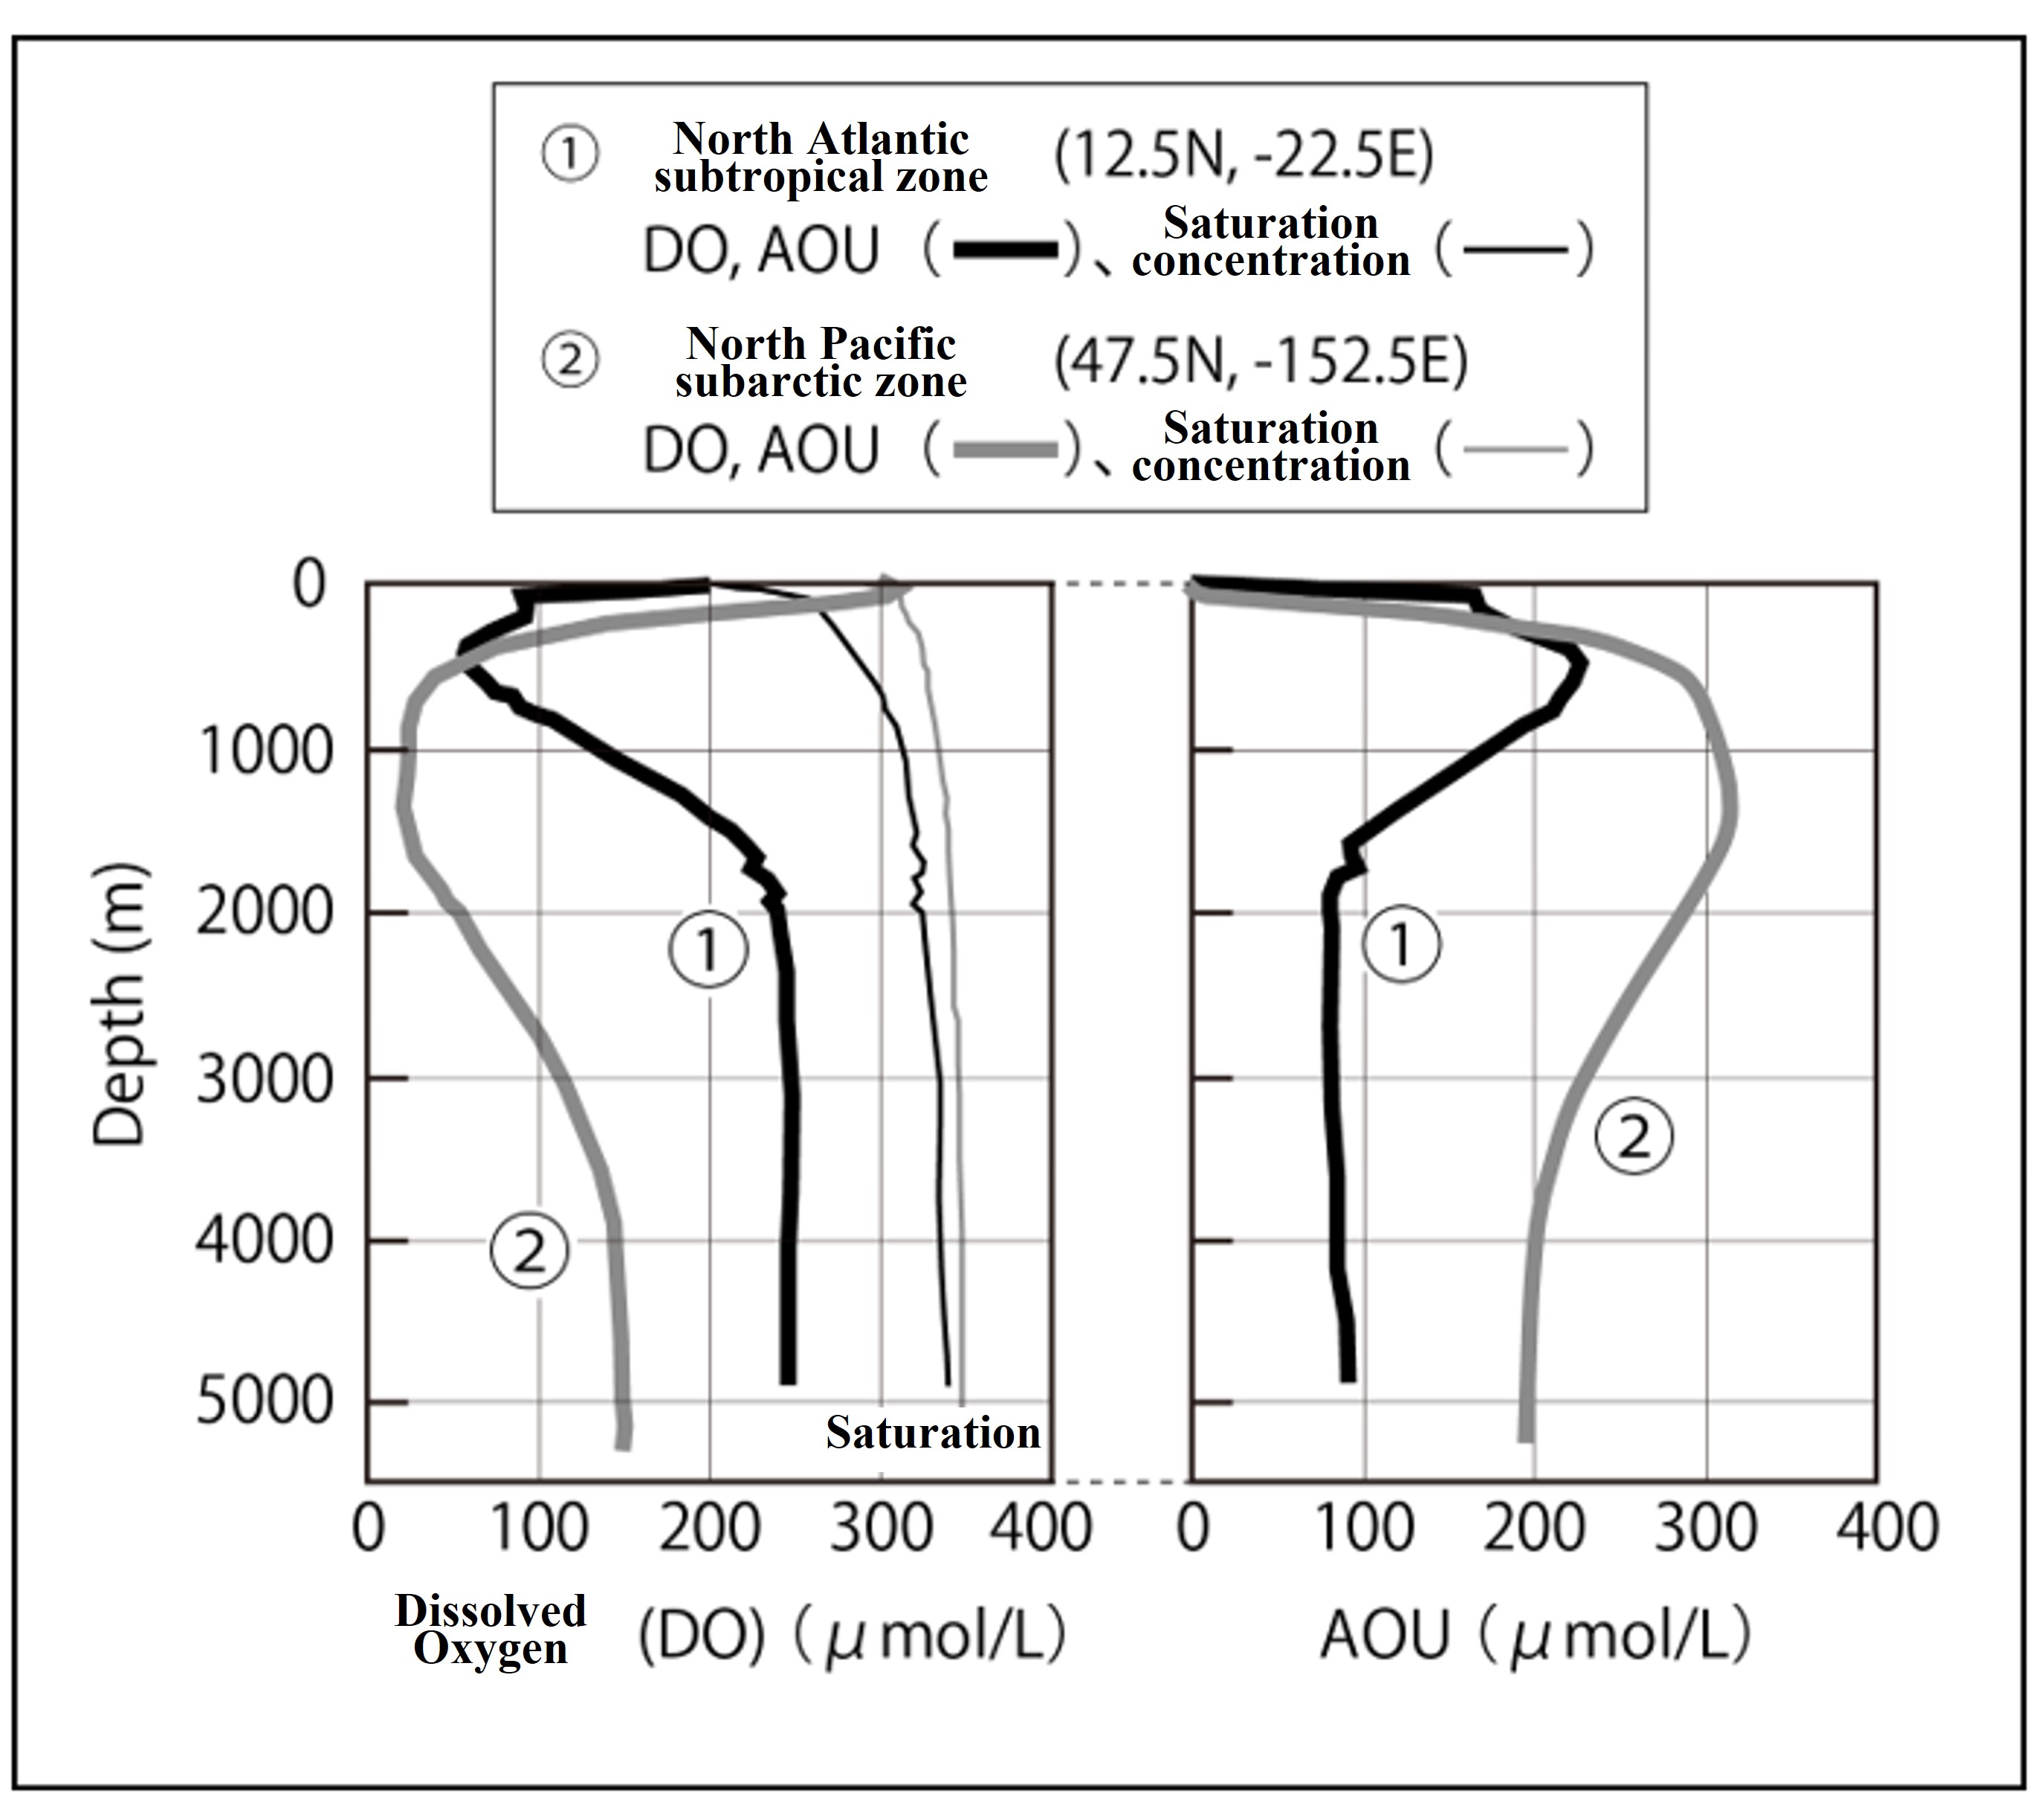
Contrasting vertical profiles of dissolved oxygen and AOU (Pacific vs. Atlantic) (←Click here)
In ocean chemistry, it is standard practice to consider the vertical distribution of each parameter, so let's put the vertical distributions of Dissolved Oxygen (DO) and Apparent Oxygen Utilization (AOU) side by side.
【High production areas in the subtropical Atlantic: Graph ①】
The distribution in the North Atlantic subtropics(12.5N, -22.5E), close to the African continent (① in the figure below) is shown. This area is known for its high biological productivity because winds sometimes blow continuously from north to south and upwelling currents are generated by ekman pumping (Mauritanian upwelling area). As a result, large amounts of particulate organic matter settle down from the surface, decompose near the pycnocline, and consume oxygen. Because of its proximity to the starting point of the deep circulation, the oxygen concentration in the deep water is high. As a result, there are marked dissolved oxygen concentration minima and AOU maxima near the pycnocline.【North Pacific subarctic (end of deep circulation): Graph ②】
The distribution of the North Pacific subarctic (47.5N, -152.5E) near the end of the deep circulation (② in the figure below) is shown. The North Pacific deep water is characterized by lower oxygen concentration than the North Atlantic deep water. This is due to the gradual consumption of oxygen during the long years of deep circulation.

Please be aware of the characteristics of the distribution of oxygen and AOU in the North Atlantic and North Pacific.

