Seasonal change of fish community in offshore of Hokkaido
セクションアウトライン
-
-
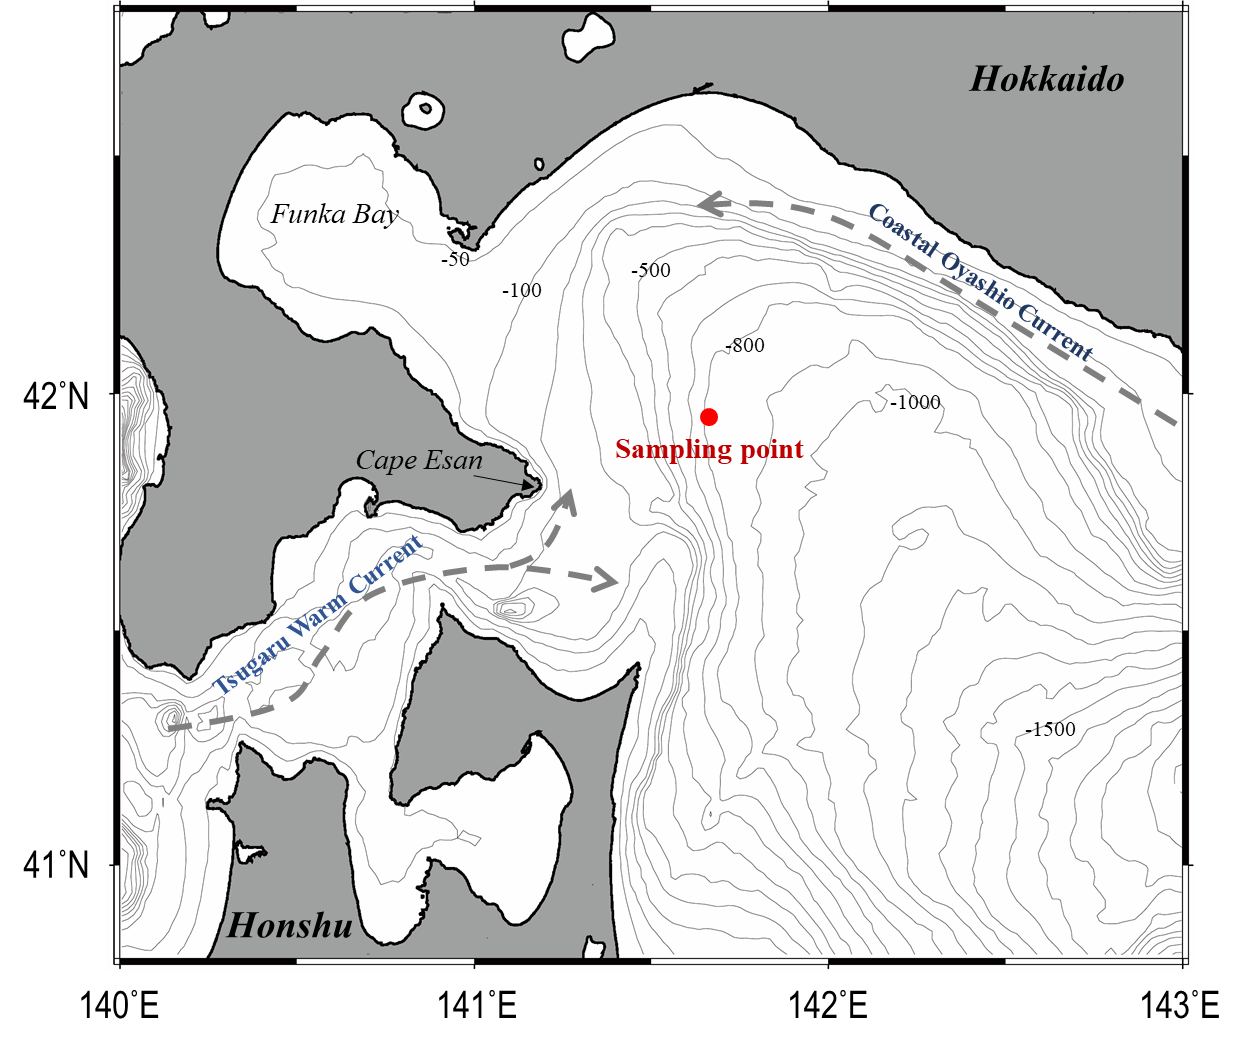
The surveys were conducted in summer (August, 2020) and winter (February, 2021), during cruises of Ushio-Maru, the training ship of Hokkaido University (summer: crs-471-2020, winter: crs-484-2021).
Sampling point is about 45 km apart from land (Cape Esan), over the deep continental slope (water depth: ca. 800 m).
-
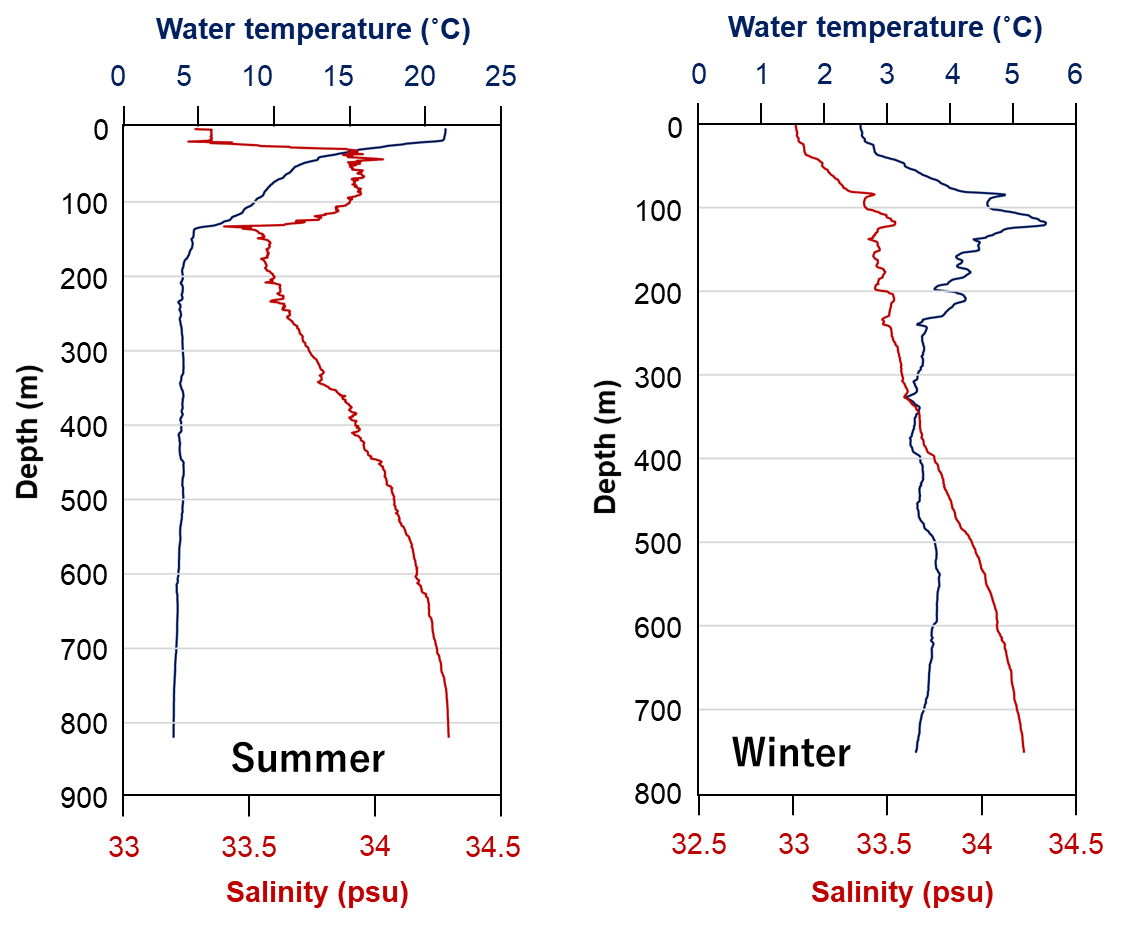
Sampling site is affected by the Tsugaru Warm Current and the Coastal Oyashio Current.
In summer, the surface layer is covered by the Tsugaru Warm Current (characterized as higher than 6°C, 33.7–34.3 psu) and the thermocline is present at 20–140 m.
In winter, the Coastal Oyashio Current (characterized as lower than 3°C, 33.0–33.3 psu) is present in the surface layer, while middle layer around 50–200
m is affected by the Tsugaru Warm Current.
-
-
-
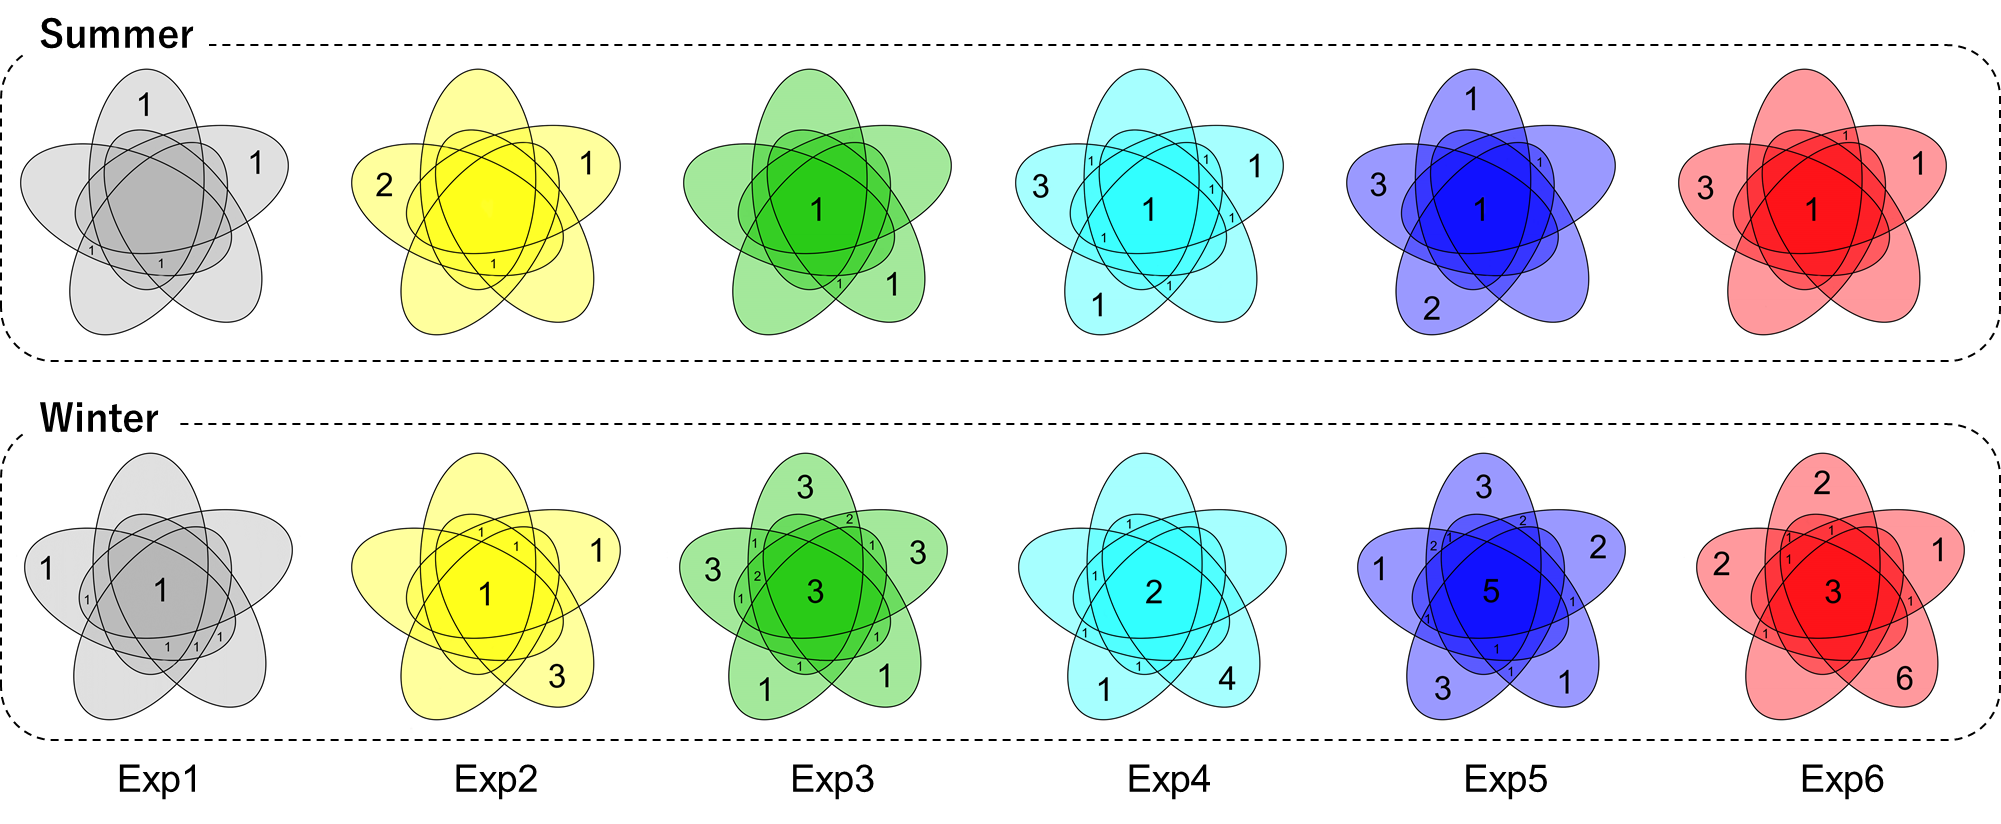
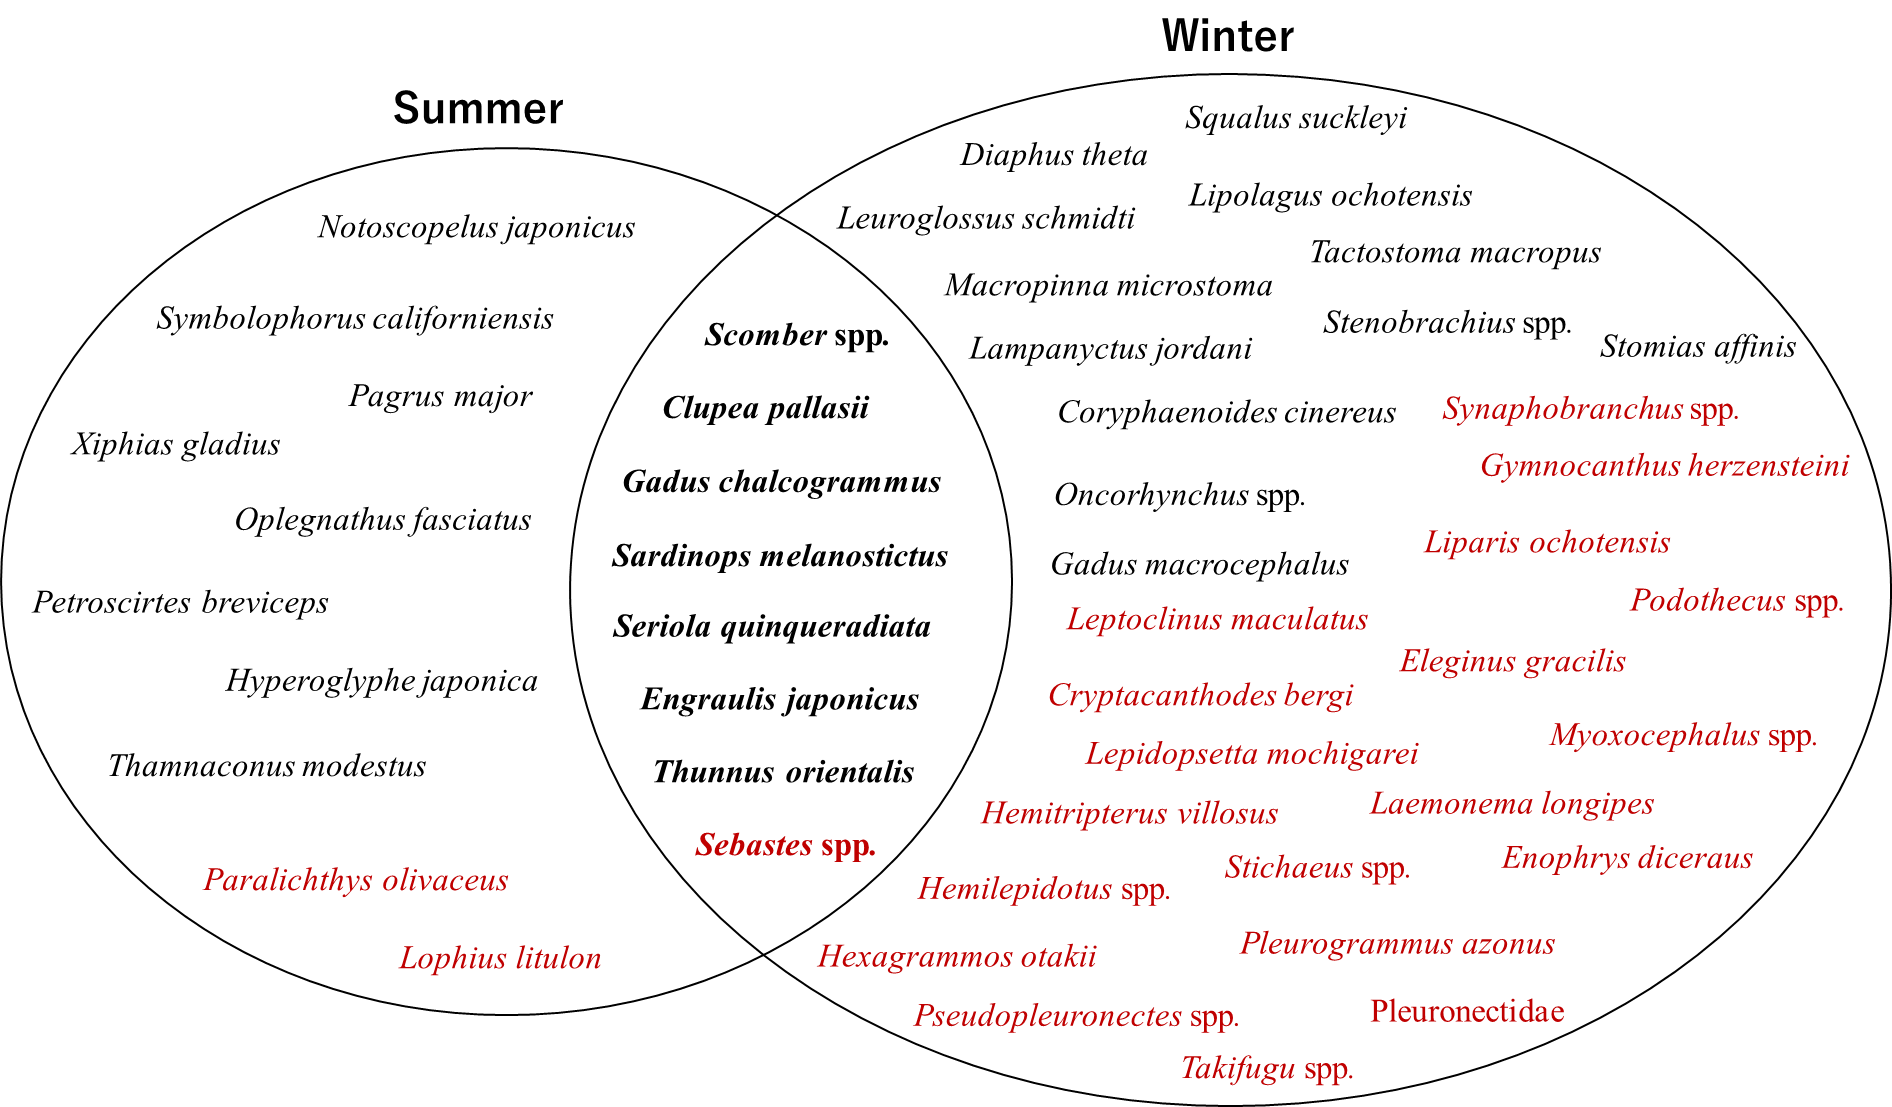
A total of 18 OTUs were detected in summer and 39 OTUs in winter, from all experimental treatment (2L x 30 samples).
Bold letter: fish which were detected in both season, Red letter: Demersal fish
-
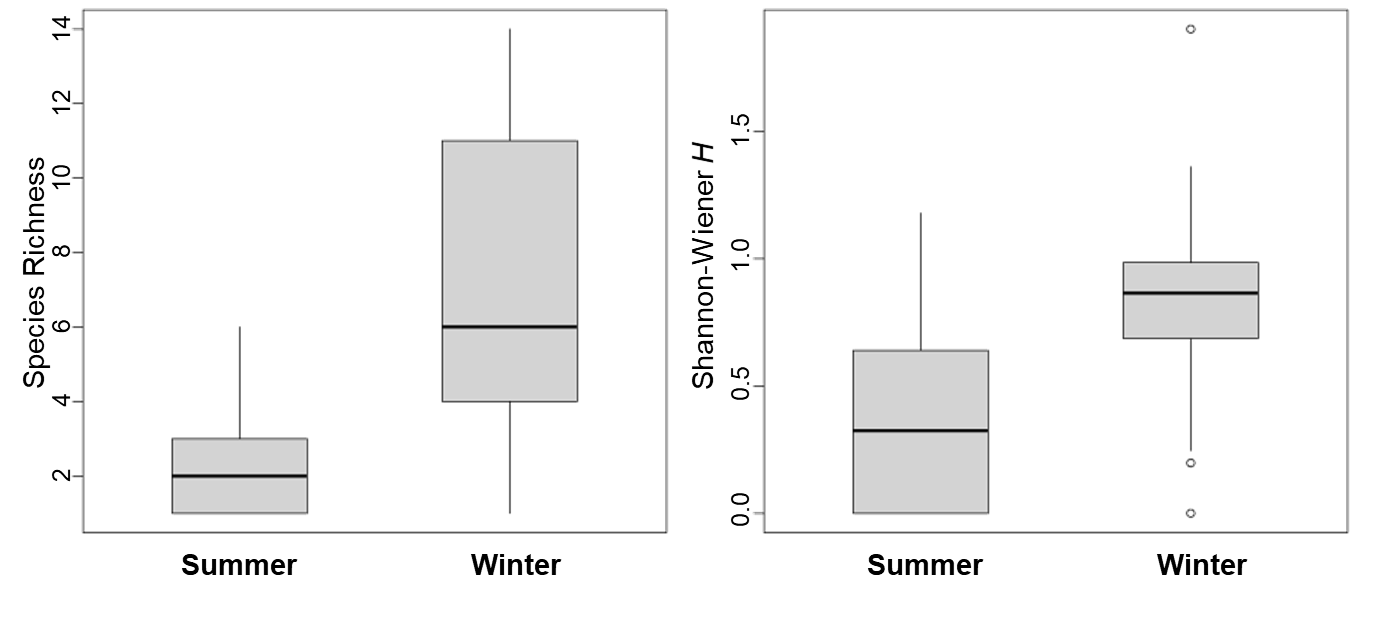
Both species richness and Shannon-Wiener H species diversity were higher in winter.
The reason can be
1)surface water and bottom water were mixed as thermocline does not exist in winter (the proportion of demersal fish is higher in winter)
2)the demersal fish which prefer cold water moved to surface as temperature is low
3)decay rate of eDNA was slower in winter due lower water temperature (summer: 21.4℃, winter: 2.9℃) and more fish were detected
-
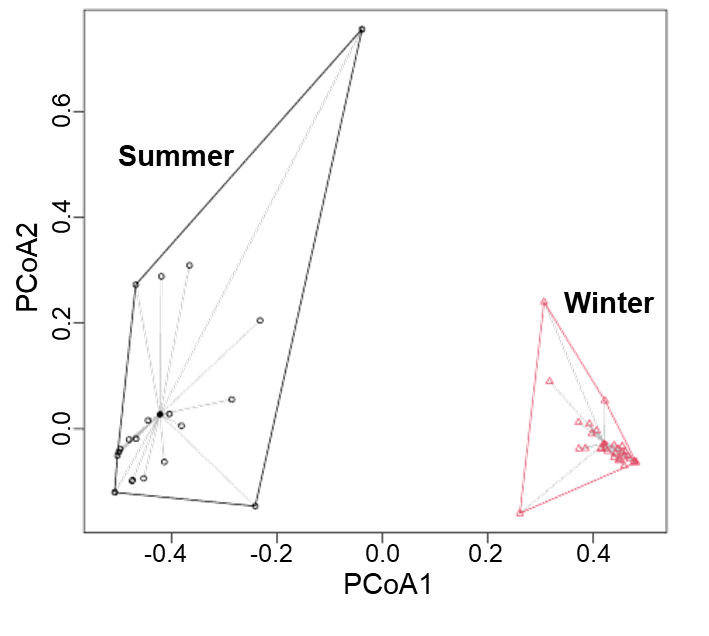
Also, the fish community calculated by PCoA showed a clear division between seasons.
-
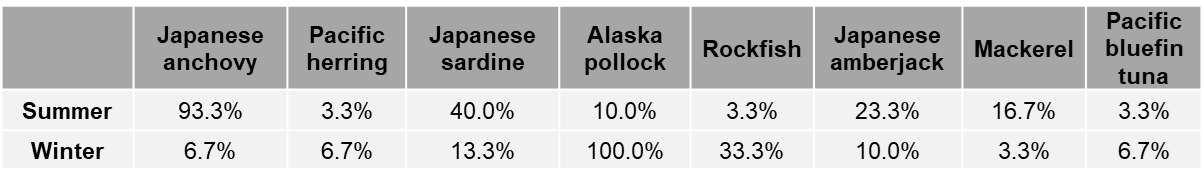
In addition to the community differences, the frequency of appearance of the 8 OTUs that were detected in common were different by season.
-
For example, the Alaska pollock was detected from 3 samples out of 30 (10%) in summer, but detected from every sample in winter (100%).
This relates to the life cycle of the Alaska pollock, that spend their spawning / hatching seasons in study area during winter and moved to the eastern Hokkaido in summer.

-
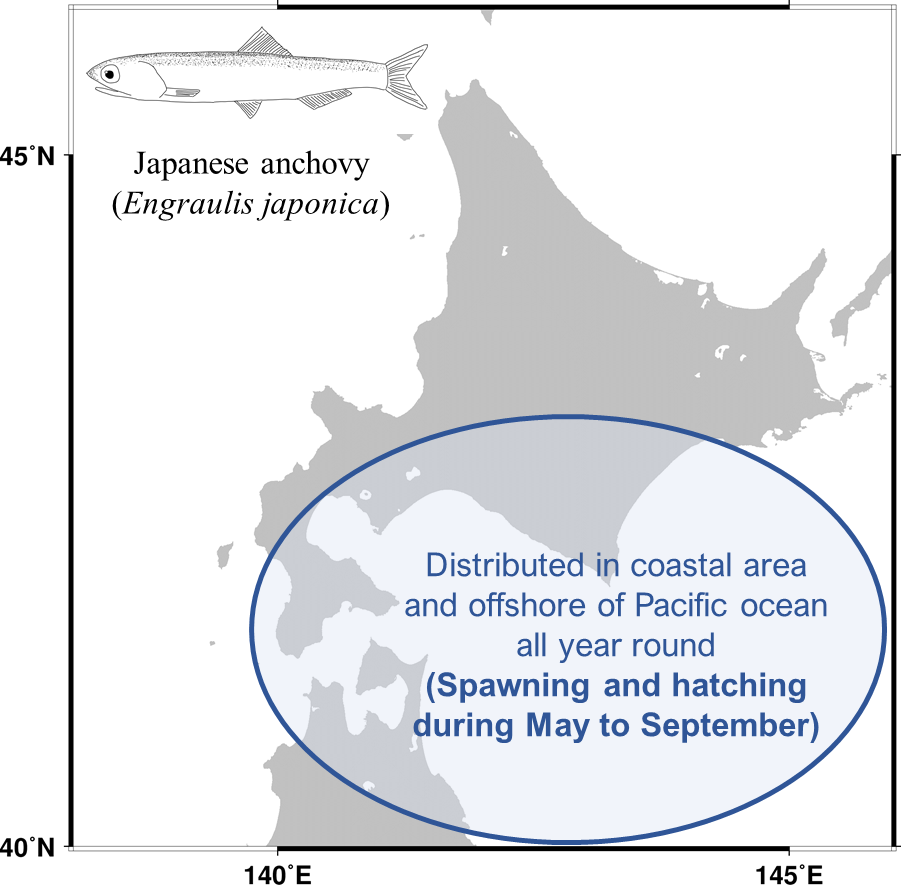
On the other hand, the Japanese anchovy (summer: 93.3%, winter: 6.7%) spend their whole life in study area, but the spawning season is summer.
-