
Contents of this course
セクションアウトライン
-
-
Since the vertical movement and mixing of seawater is governed by density differences, the movement of water has been studied from the density differences of water by measuring salinity and water temperature.
Water masses in a given area and at a given depth have a certain characteristic (unique) range of salinity and temperature. To understand the movement and mixing of water masses, it is fundamental to investigate water temperature and salinity.
-
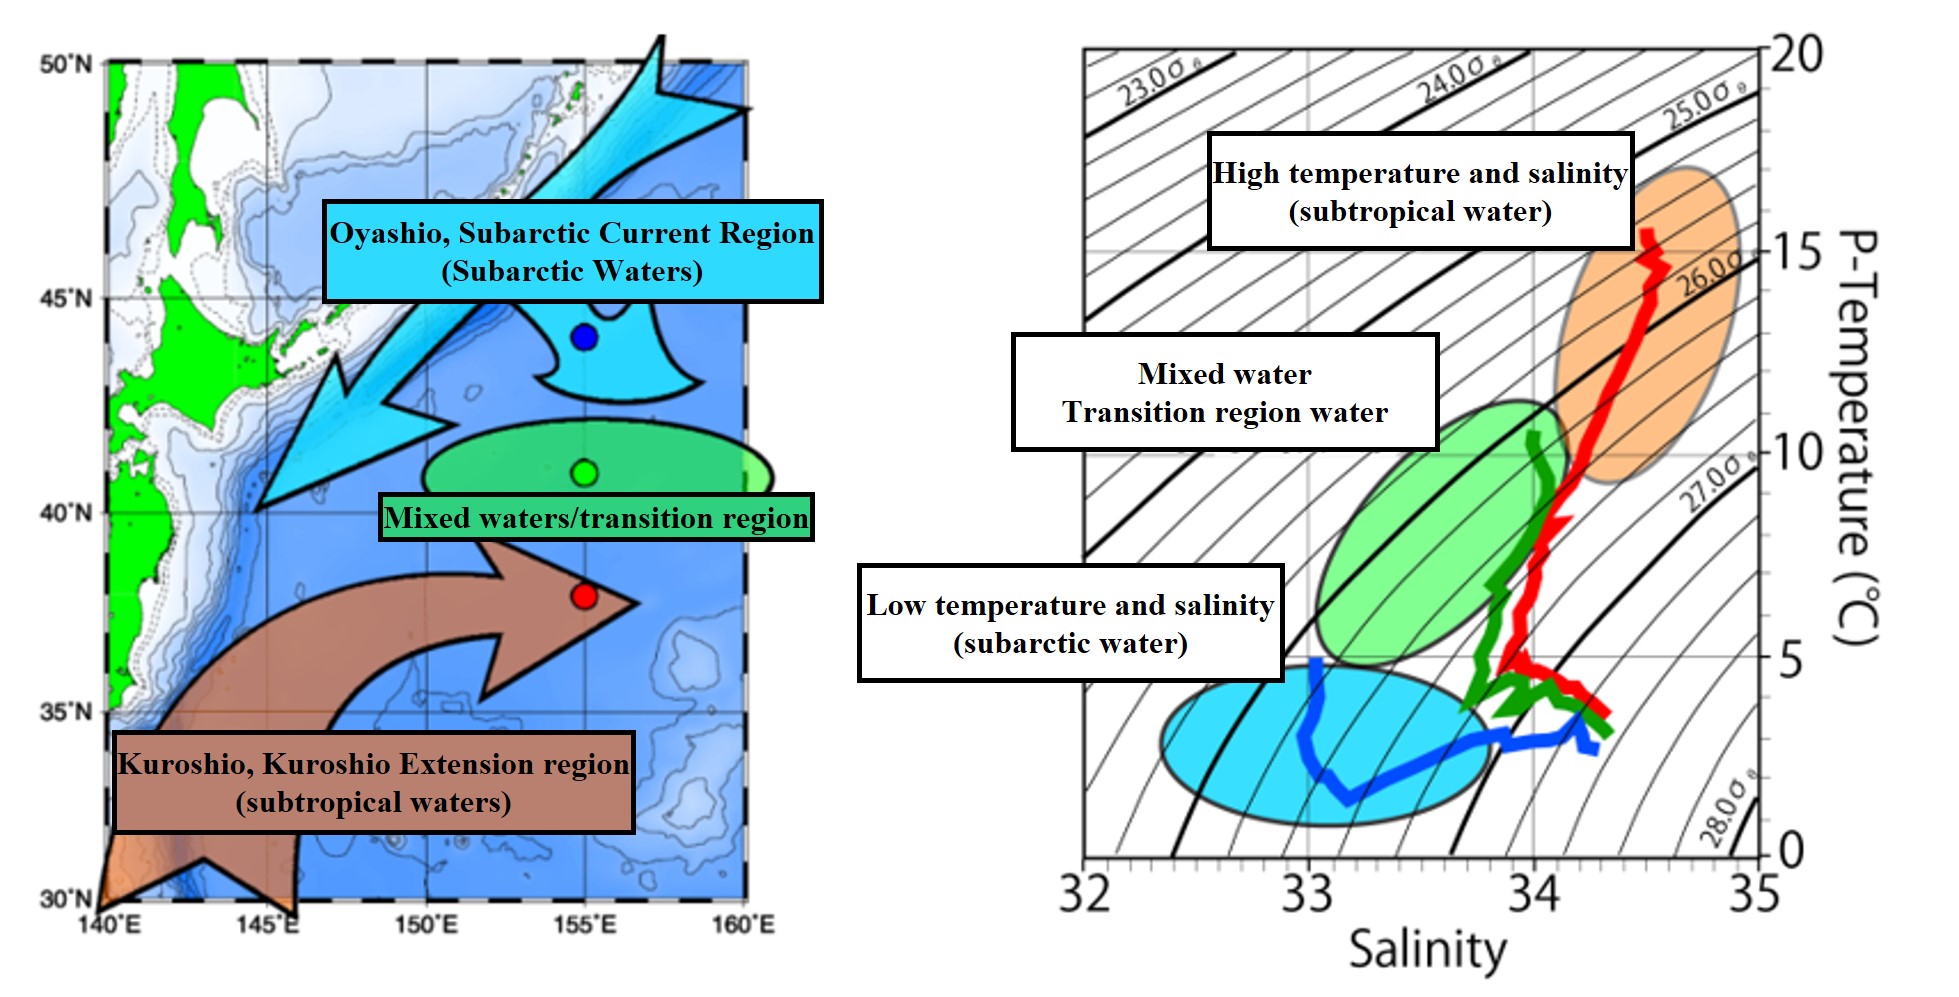
An X-Y plot of seawater temperature (T) and salinity (S) measured along an observation line (vertical or horizontal) is called a T-S diagram.
Each water mass has its own characteristic plot. This is useful for classifying water masses and studying the movement and mixing of water masses, so let's use the T-S diagram around Japan as an example to understand the characteristics of the subtropical and subarctic and their transition regions in the Northwest Pacific.
-
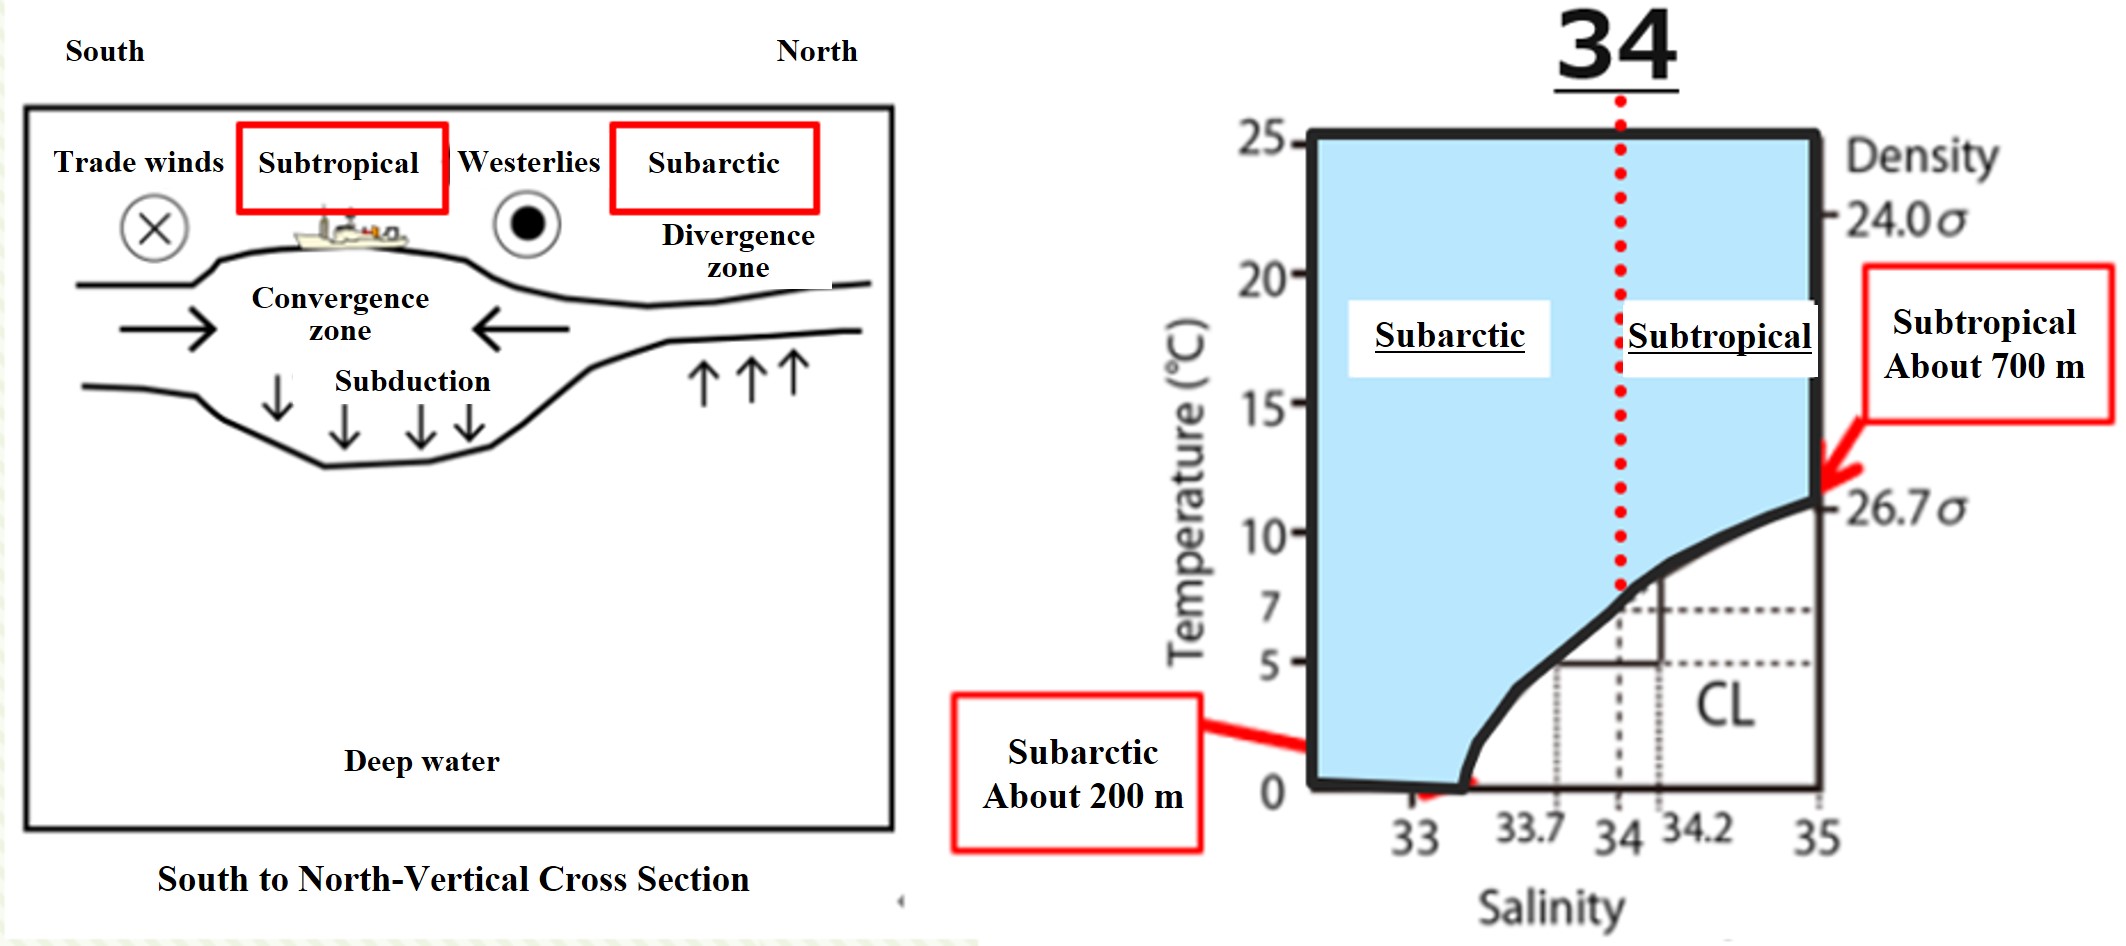
Roughly, a density of less than 26.7σ is considered a surface layer. The surface layer is the combination of the surface mixed layer and the subduction layer. The subtropical has a thick surface layer and the subarctic has a thin surface layer. The subarctic and subtropical of the North Pacific are divided by a salinity of 34.
-
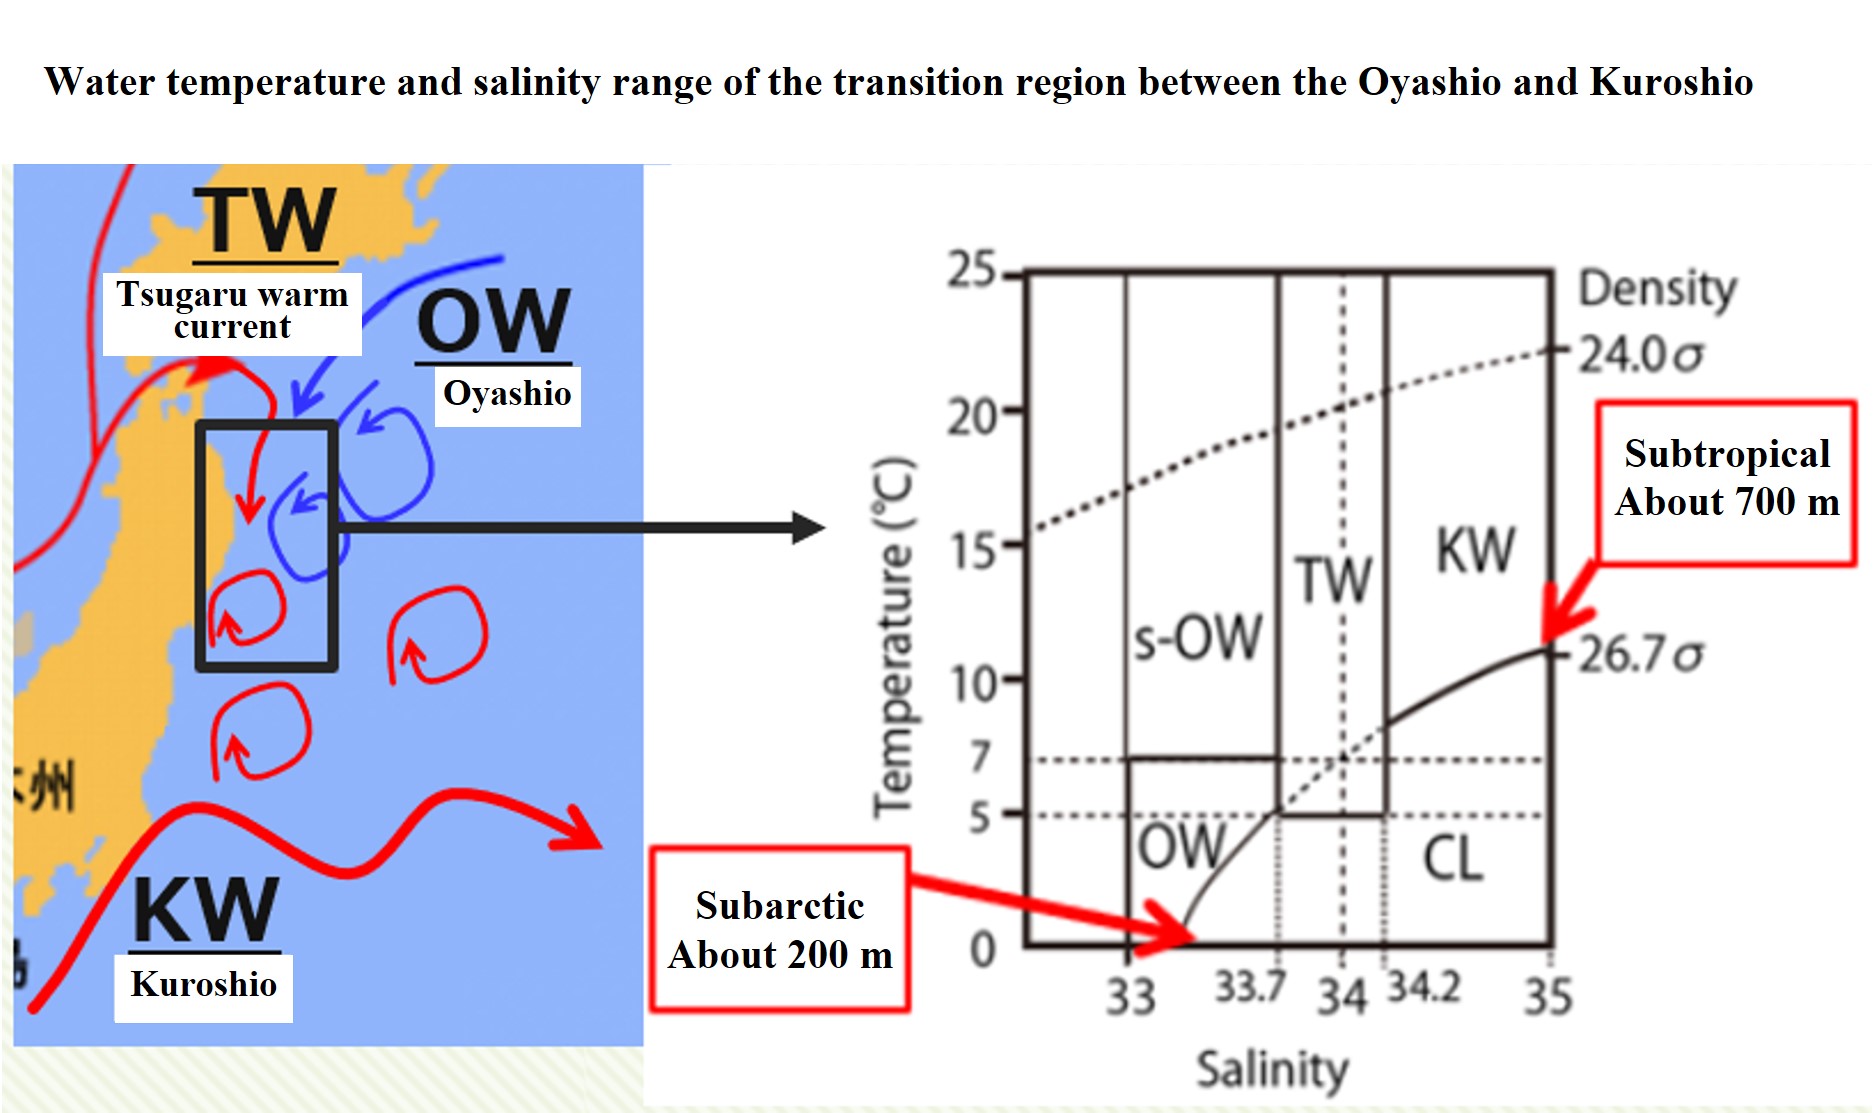
Understand the water temperature and salinity range of the Oyashio and Kuroshio currents transition regions.
-
Learn about the ocean on the Japan Meteorological Agency (JMA) website as well.
-
This is a predictability experiment and information provided by the JAMSTEC Application Lab along the coast of Japan.
-
The Japan Coast Guard also provides detailed information on ocean currents and tides.
-
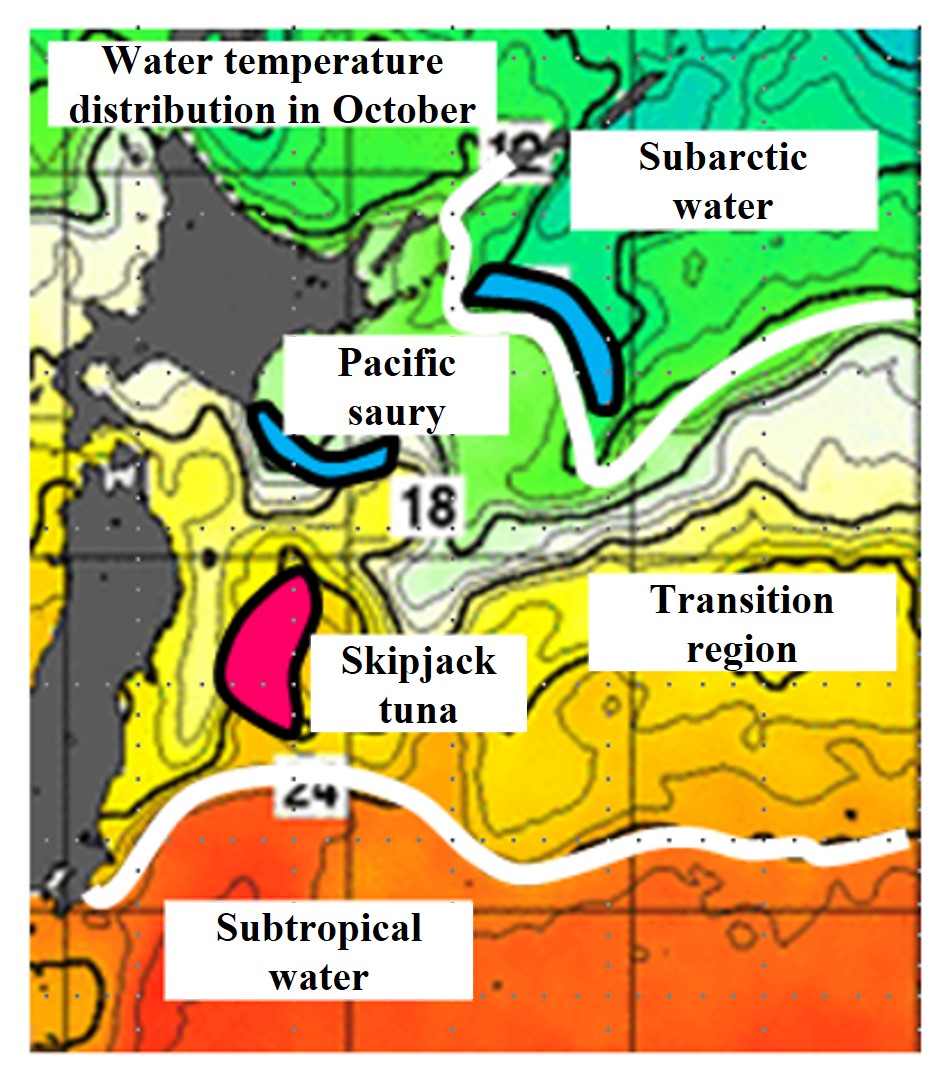
Fisheries resources (e.g., fish) are also distributed according to the distribution of water temperature.
-