
T-S diagram of representative currents and water masses in the Pacific Ocean near Japan
An X-Y plot of seawater temperature (T) and salinity (S) measured along an observation line (vertical or horizontal) is called a T-S diagram.
Each water mass has its own characteristic plot. This is useful for classifying water masses and studying the movement and mixing of water masses, so let's use the T-S diagram around Japan as an example to understand the characteristics of the subtropical and subarctic and their transition regions in the Northwest Pacific.
Two representative ocean currents around Japan are the Oyashio and the Kuroshio. Both are western boundary currents.
The Oyashio Current originates in the subarctic waters of the North Pacific Ocean and flows from north to south along the western coast of the subarctic, carrying cold and low-salinity subarctic waters.
The Kuroshio Current originates in the subtropical waters of the North Pacific and flows from south to north along the western coast of the subtropical, carrying hot and high-salinity subtropical waters.
The Oyashio and Kuroshio currents do not collide directly, but eddies derived from both currents collide and mix in the intermediate region. The intermediate region is called the mixing or transition region.
Oceanographic observations were made at stations in the subarctic (blue), transition (green), and subtropical (red) regions of the Northwest Pacific (circled in the figure below (left)), and water temperature and salinity from surface to depth were plotted on a T-S diagram (figure below (right)).
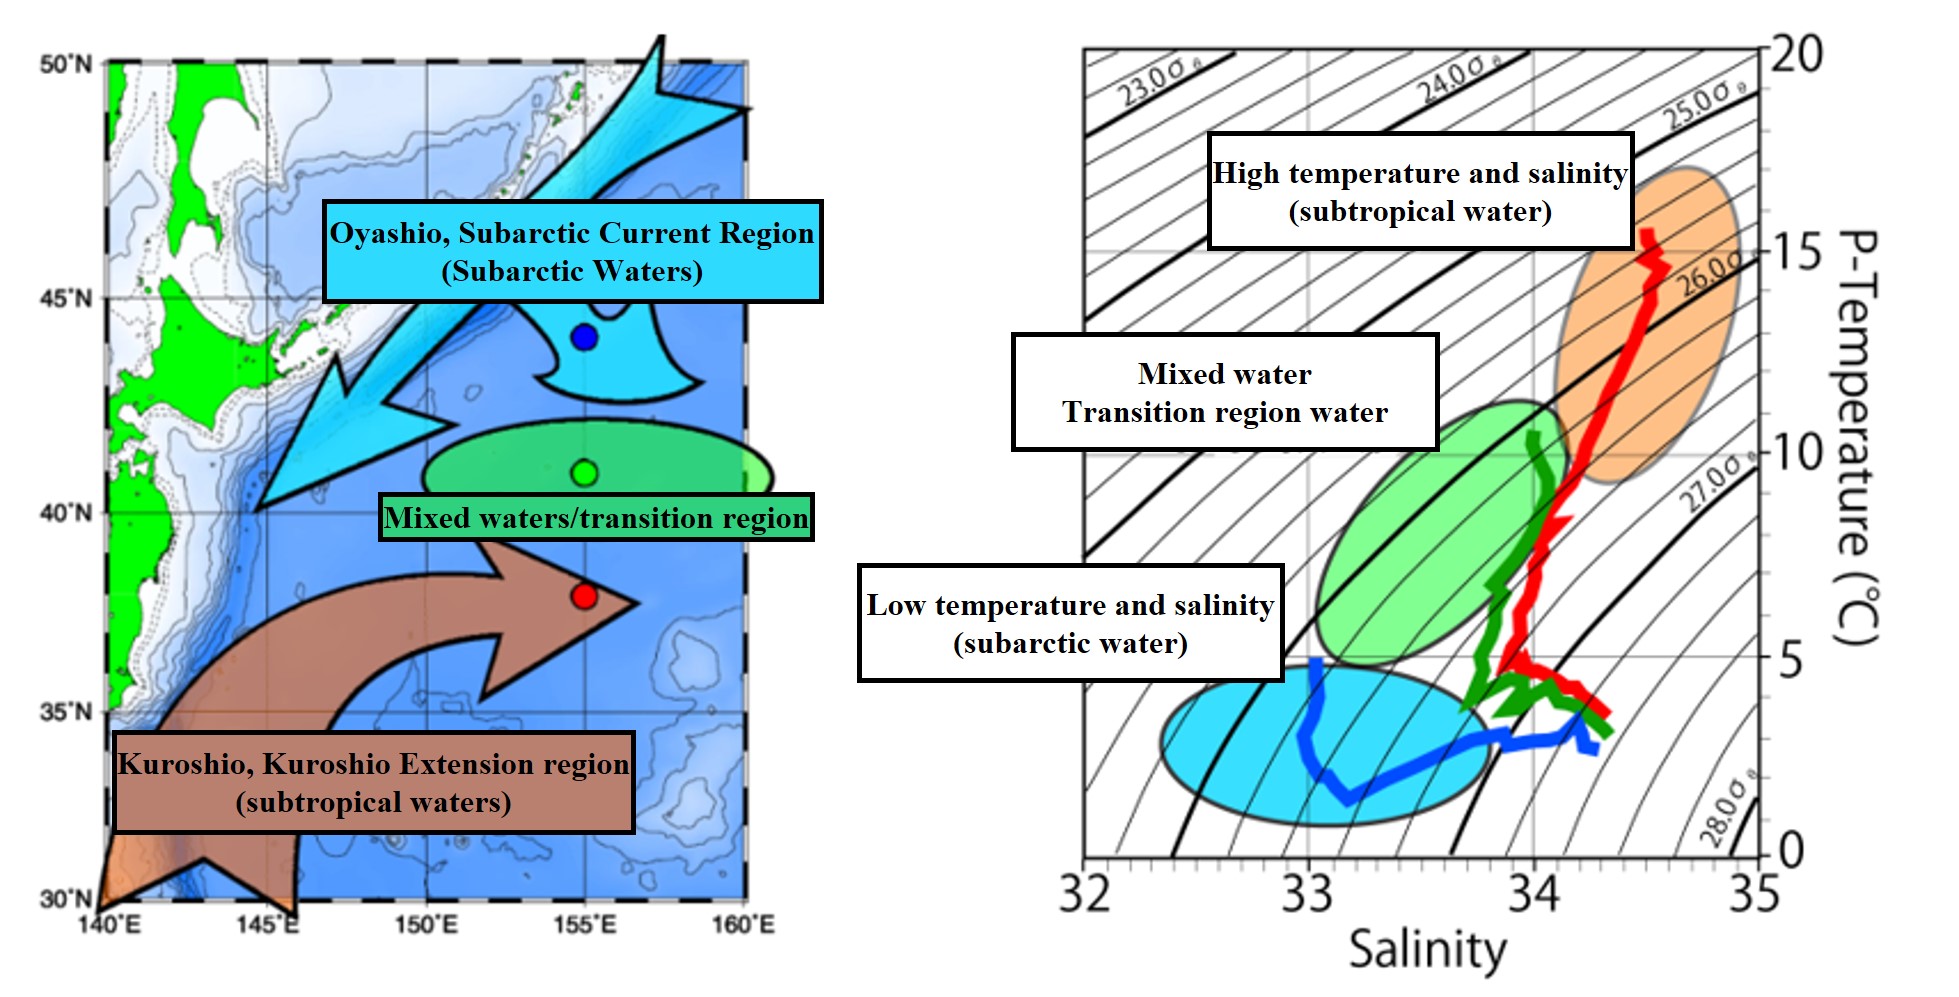
The black curve on the right figure is the isodensity line calculated from water temperature and salinity.
For example, 25.0σ and 26.0σ mean densities of 1.025 g cm-3 and 1.026 g cm-3. (As defined earlier, we will henceforth convert seawater density to σ.)
Since the less dense (lighter) water is floating on the surface and the more dense (heavier) water is sinking deeper, it roughly plots (left) up to the surface and (right) down to the deeper layers.
Looking at this T-S diagram, the surface T-S for each ocean (subarctic, transitional region, and subtropical) is plotted in its unique range, but as we move toward the deeper layers, the plots converge in the lower right direction (high-density side). This convergence to the lower right is the North Pacific Deep Water. The origin of the deep water is the Antarctic Bottom Water (originally the North Atlantic Deep Water), which has been transformed to form a thick layer in the deep Pacific Ocean and spread horizontally.
Thus, the T-S range of the North Pacific Deep Water is nearly the same in both subtropical and subarctic.
------------------------------------------------------
TS Diagram of the North Pacific (summary)
TS Diagram
Upper left side (low salinity and high water temperature): surface direction
Lower right side (high salinity and low water temperature): seafloor direction
North Pacific
Upper left side plot (surface)
High water temperature, high salinity: subtropical
Low water temperature, low salinity: subarctic
In-between : transition region
Lower right side plot (deep)
Low water temperature, high salinity: North Pacific Deep Water
(Convergence to the same TS in different ocean areas)
--------------------------------------------------------------------