
Distribution of fishery resources and TS distribution (Supplement)
TOnce the T-S distribution is understood, interest in various areas of fisheries oceanography will increase. For example, Pacific saury hatched in the subtropical moves north to spend the summer in the subarctic where food is abundant. In the autumn, they migrate southward to the subtropical where they spawn (Supplement ③). Fish have optimal water temperatures for their juvenile stage, optimal water temperatures after they grow up, and viable water temperature zones, which vary from species to species. Since fish are sensitive to water temperature and follow the water temperature distribution throughout their lives, humans who pursue fishery resources must also keep a close eye on T-S. The Japan Fisheries Information Service Center (JAFIC) provides information on sea conditions for major fish species. The T-S distribution is also important in the actual fishing industry, as shown in the chart of active fishing grounds and water temperature distribution overlaid on the chart.
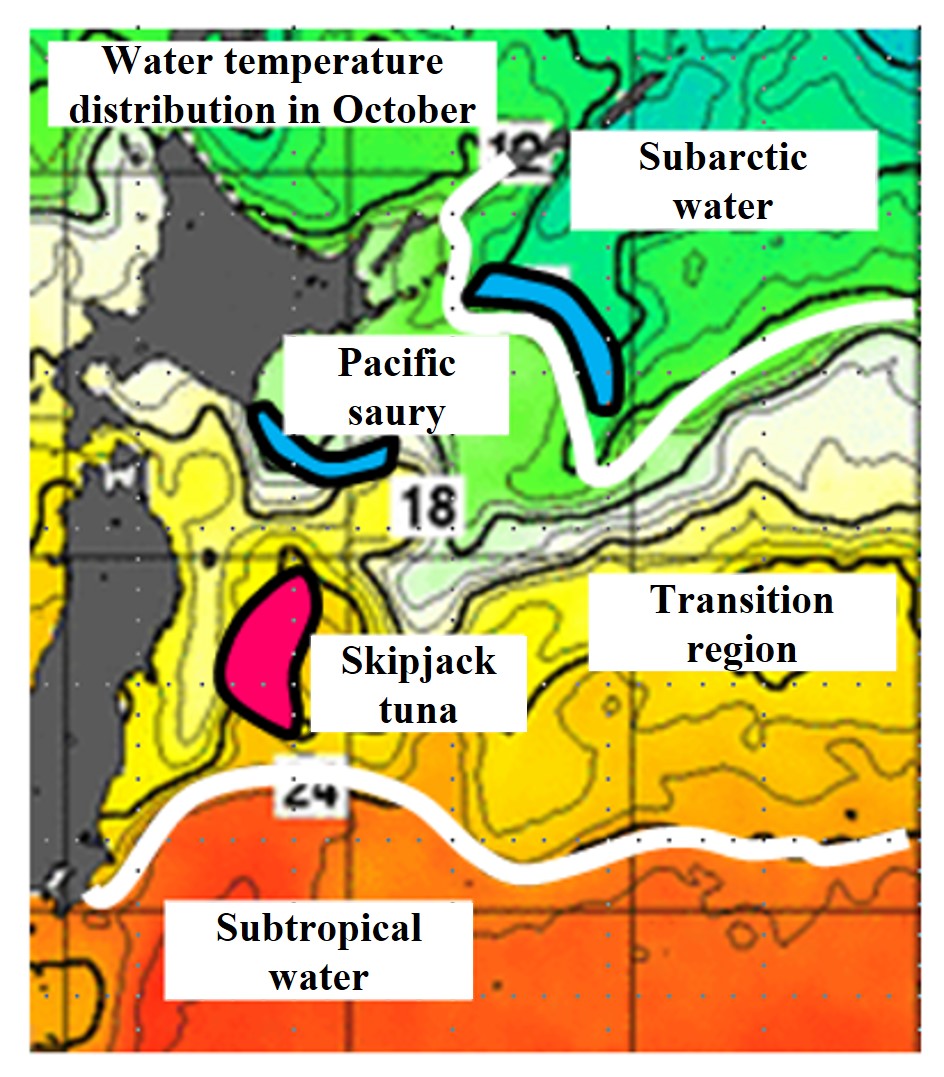
According to Introduction to Fisheries Oceanography (Japanese Society of Fisheries Oceanography, Kodan-sha, Chapter 4.5: Yukihiko Ito), there are several warm water eddies (anticyclonic eddies) originating from subtropical waters in the transition zone, and the zonal warm water streamers derived from the warm water eddies are the northward migration routes of sardines, mackerels, and pacific saury. Fishing grounds for Japanese sardines are located at the tip of the warm water streamers, and skipjack tuna and bluefin tuna are formed inside and along the edges of the warm water eddies. On the other hand, during the southward migration season (autumn), the cold-water eddy originating from subarctic waters serves as a migration route. The southward migration of pacific saury and mackerel along the cold-water eddy is stalled by the subtropical warm-water eddy, and dense fishing grounds are formed in the frontal areas of cold and warm water. Based on this description, the water temperature distribution and estimated fishing grounds in October are shown in the figure below. For more details, please read Introduction to Fisheries Oceanography.