
Explanation of “apparent oxygen consumption” AOU
At this point, we must define the term oxygen consumption a little more precisely. The "oxygen consumption amount" calculated earlier is the "apparent oxygen consumption amount" after a certain body of water has cut off contact with the atmosphere.
Why “appearance”?
For example, suppose water that was on the surface has penetrated to the subsurface layer. Phytoplankton often exist in high densities in the subsurface layer, showing the sub-surface chlorophyll maximum (SCM).
Weak light reaches even the subsurface layer, which has no contact with the atmosphere, and oxygen is produced through photosynthesis. Therefore, the "oxygen consumption" calculated earlier includes both consumption through respiration and production through photosynthesis. In other words, [apparent oxygen consumption] is the amount obtained by subtracting [the amount of oxygen produced by photosynthesis] from [the amount of oxygen consumed by respiration]. Here, the apparent oxygen consumption is called Apparent Oxygen Utilization (AOU) and is expressed by the following formula.
[Apparent oxygen consumption;AOU] = [O2]0 - [O2measured value]
[O2measured value] is the measured value of dissolved oxygen concentration in water sampled at a certain depth.[O2]0 represents the initial oxygen concentration when the water was at the sea surface.
Inside the ocean, the temperature of seawater remains almost constant. It is thought that the temperature of the seawater is conserved from the time it sank (when it was on the sea surface) to the present (the time of observation). If the temperature of water at the surface is T°C, the temperature will not change after the water sinks. Since the temperature is constant, the calculated oxygen saturation concentration does not change. Substitute the observed water temperature T into the formula for oxygen saturation concentration to find [O2]0. If deep water is sampled, AOU usually takes a positive value. This is because photosynthesis cannot occur in the middle and deep layers where sunlight does not reach at all, so oxygen in seawater is constantly consumed. On the other hand, in water in the photic zone, oxygen production is active through photosynthesis, so AOU may take a negative value.
Let's explain the vertical distribution of oxygen concentration and AOU using a diagram. The figure below shows a case where oxygen has reached equilibrium between seawater in the surface mixed layer and the atmosphere. However, there are no biological effects in seawater, and oxygen generation and consumption are not considered. The area where deep water is formed (the high latitudes of the North Atlantic) is cold, and the surface seawater cools to 1.5°C before sinking into the deep layer. Calculating the oxygen saturation concentration of seawater at a water temperature of 1.5℃ is 341 μmol/L.
This deep water takes over 1000 years to be transported to the mid-latitudes of the North Pacific Ocean. Without the action of living organisms, the O2 concentration in the deep water (1.5℃) remains at the initial oxygen saturation concentration (341 μmol/L). On the other hand, the surface layer in the mid-latitudes of the North Pacific near the end of the deep circulation is warm, and the oxygen saturation concentration in the surface mixed layer at a water temperature of 20°C is calculated to be 234 μmol/L. If we plot the oxygen saturation concentration in the mid-latitudes of the North Pacific on a vertical distribution, it will look like the diagram on the right below.
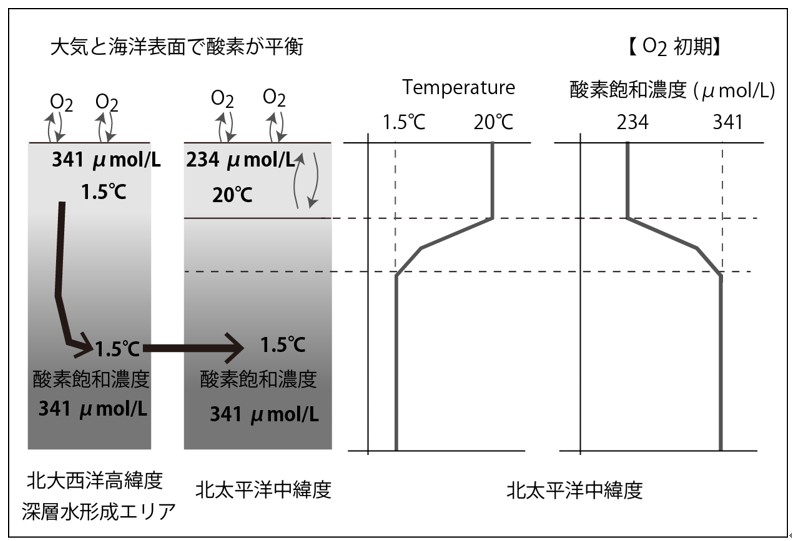
In the diagram above, the oxygen saturation concentration is written as [O2 initial]. Oxygen saturation concentration is calculated from the water temperature (and salinity) at that depth.
"Factors determining the vertical distribution of dissolved oxygen in seawater"
Next, we will consider changes in the vertical distribution of dissolved oxygen in the case of organic matter decomposition by bacteria in water, that is, oxygen consumption.
Deep water (1.5℃) that sinks in the high latitudes of the North Atlantic is transported to the mid-latitudes of the North Pacific by deep circulation. The picture on the left below shows the decomposition of organic matter, oxygen consumption, and changes in oxygen concentration during this process. The vertical distribution of oxygen concentration in the mid-latitudes of the North Pacific near the end of the deep circulation is shown in the figure on the right below. The following is a step-by-step explanation.
- In the high latitude region of the North Atlantic (deep water formation area), water temperatures drop to 1.5℃ in winter. That low temperature water can dissolve a lot of oxygen. When it reaches equilibrium with the atmosphere, its oxygen saturation concentration is 341 μmol/L.
- This water sinks deep into the ocean. During the dive, oxygen is consumed by the decomposition of dissolved and particulate organic matter. The initial concentration (saturated concentration at a water temperature of 1.5°C) was 341 μmol/L, but it decreased to 300 μmol/L when reaching the deep layer.
- This North Atlantic deep water takes over 1000 years to reach the mid-latitudes of the North Pacific. The water temperature has remained at 1.5℃ for 1000 years. As deep water moves, the organic matter it contains decomposes and the oxygen concentration gradually decreases. (300 → 250 → 151 → 119 μmol/L)
- Oxygen concentrations in deep water in the mid-latitudes of the North Pacific have decreased to 119 μmol/L. On the other hand, the surface water in the same area is warmer, with a water temperature of 20°C. Since surface water is in contact with the atmosphere, the oxygen concentration in surface water is equal to the saturation concentration. The oxygen saturation concentration at a water temperature of 20°C is 234 μmol/L.
- When we conducted ocean observations in the mid-latitudes of the North Pacific Ocean and obtained the vertical distribution of oxygen concentration, we obtained the result as shown in the thick black line in the figure on the right below. The thick gray line in the figure below on the right is the oxygen saturation concentration calculated from the water temperature.
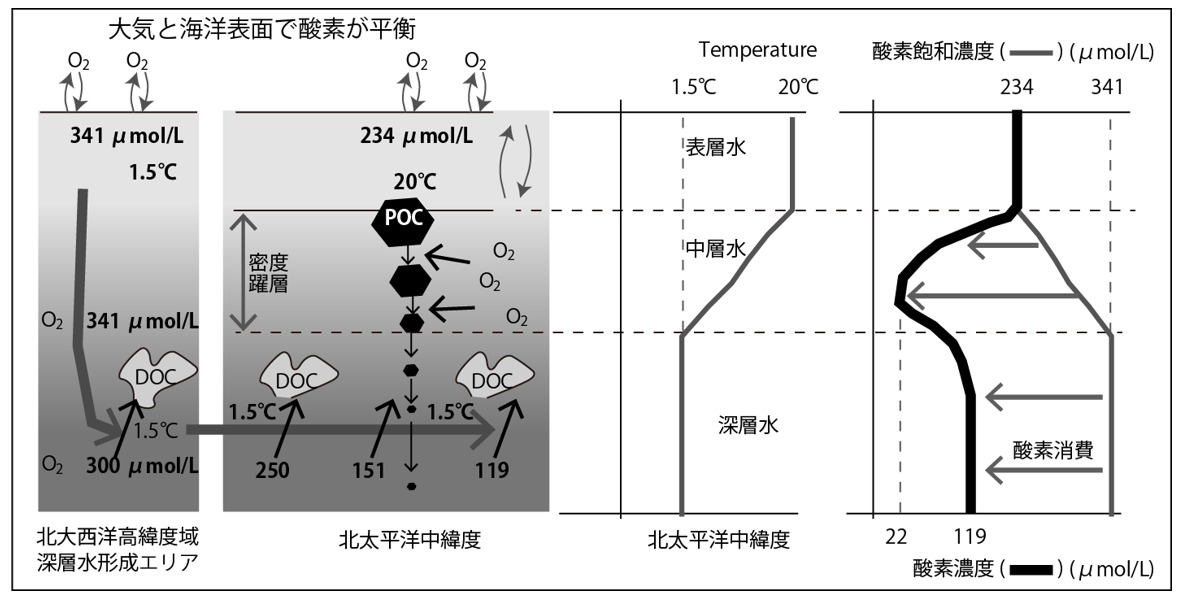
A characteristic feature of the vertical distribution of oxygen in the mid-latitudes of the North Pacific is that the oxygen concentration drops significantly and reaches a minimum in the water depth zone (around 1000 m) marked as intermediate water. The main reasons for forming this oxygen minimum are explained below.
- Particulate organic carbon (POC) produced in the surface layer settles in seawater, but the particle density of fluffy marine snow is close to seawater density, so it cannot exceed the pycnocline. As a result, most of the POC is decomposed in the pycnocline layer above the deep water, and oxygen consumption is highest at around 750 m in the pycnocline layer. For the same reason, the oxygen concentration is lowest at depths within the pycnocline (750-1000m), and a minimum oxygen layer can be seen as shown in the figure below on the right. The apparent oxygen consumption (AOU) corresponds to the length of the arrow (← oxygen consumption) in the above right diagram. The AOU is zero in the surface layer, and the AOU is maximum in the oxygen minimum layer. However, in the surface layer, oxygen is generated through photosynthesis, so AOU may take a negative value.
This describes the average picture of oxygen distribution seen in the Pacific and Atlantic oceans. This does not apply to all individual sea areas. For example, at a depth of around 750 meters in the western North Pacific near the Japanese archipelago, water that has just sunk in the surrounding sea area is spread out horizontally. Therefore, the oxygen concentration at 750 m in the western North Pacific is uniquely higher than the average for the entire North Pacific (this is explained by the horizontal distribution of ocean oxygen).