セクションアウトライン

    • This is an introduction to practical training at the Field Science Center for Northern Biosphere and Akkeshi Marine Biological Station.

    • In the rocky intertidal zone, sessile organisms such as seaweed exhibit a zonal distribution with different habitat heights depending on the species. In this practice, the belt transect method is used to investigate its vertical distribution.


      Tools:

      Rope, quadrat (20cm x 20cm), angle scale, drawing board, underwater notebook, graph paper, pencil, folding scale, silicon tube, plastic bag, box glasses


      Method:

      (1) A survey line is set by laying a rope at a predetermined survey location (where a zonal distribution can be seen, including from the top of the vertical distribution to the lower part of the intertidal zone).

      (2) Place the quadrat along the line, apply the slant rule parallel to the line and record the angle.

      Figure 1

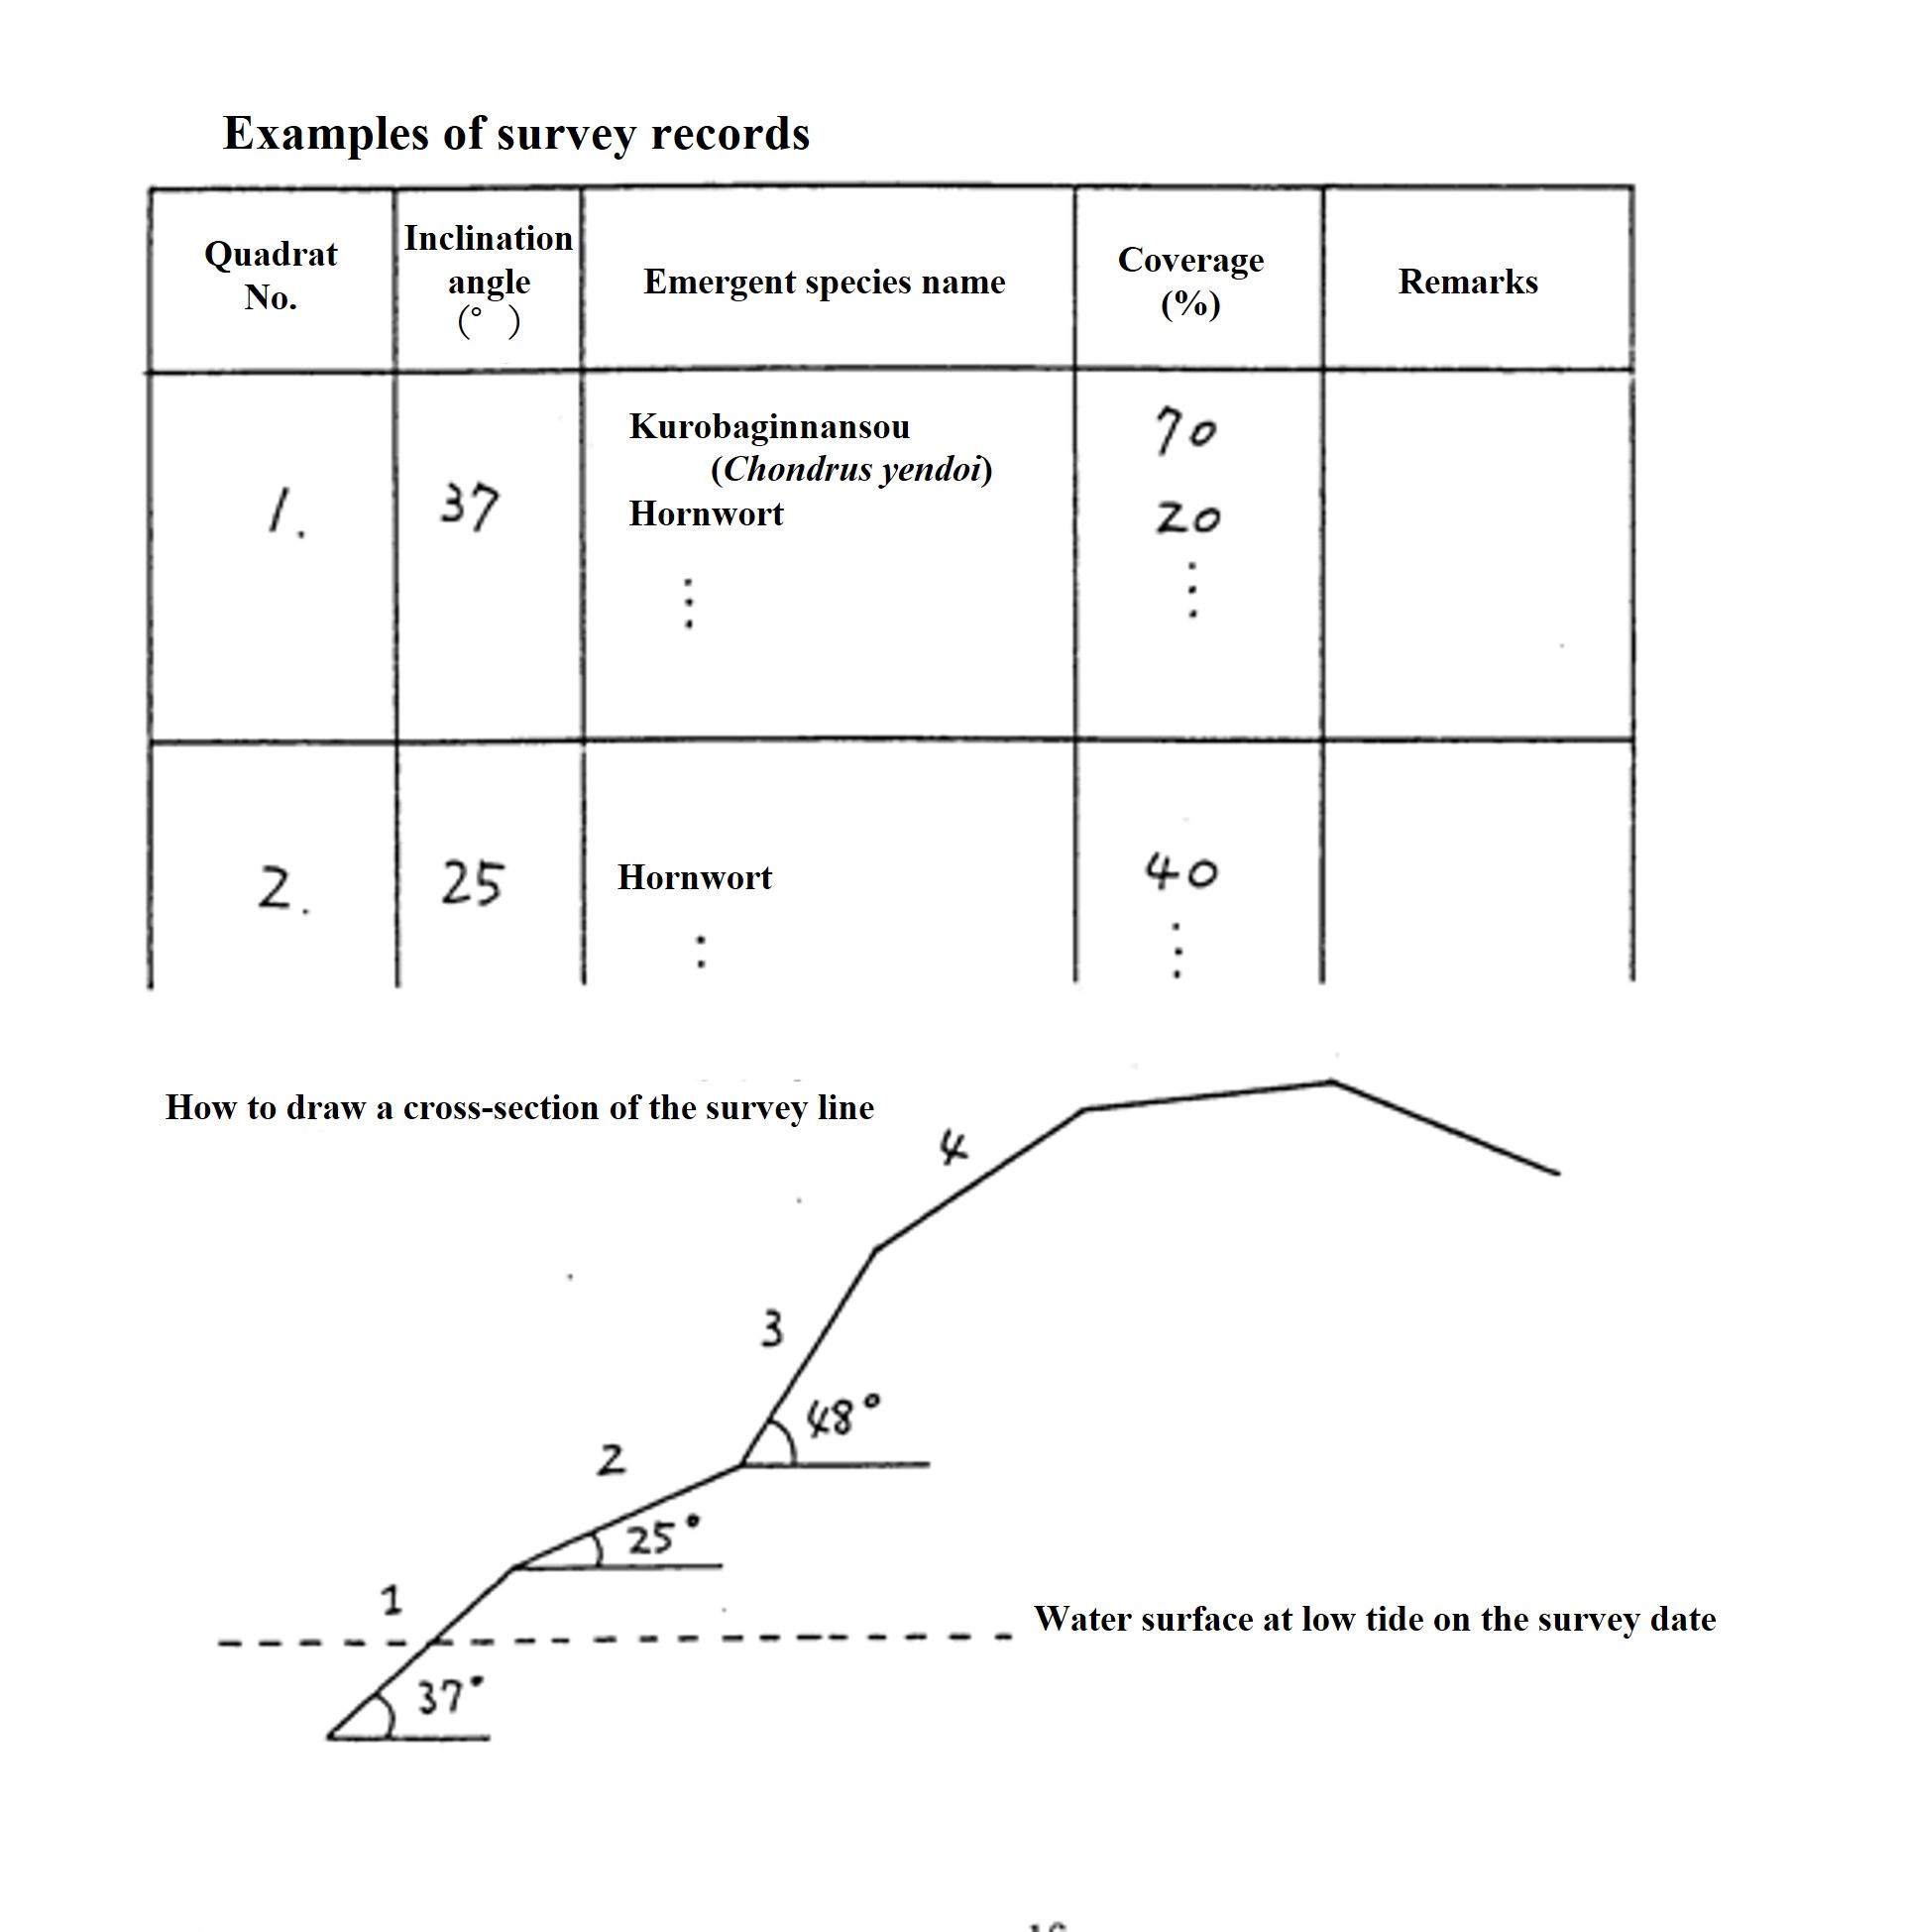
      (3) Record the types and coverage of creatures within the quadrat. In addition to algae, sessile animals and creeping animals with a narrow range of movement are also recorded. Coverage is the percentage of the area covered by the organism within the quadrat. The bare surface percentage is also measured and recorded. If it overlaps with other creatures, the total coverage of the species that appeared there may exceed 100%.

      Give a value every 10% on the spot. If it is less than 5%, it will be +. Coverage may later be indicated in six ranks as follows:

       +(+); 15-20%); 220-40%); 340-60%); 460-80%); 580-100%)。

       If it is difficult to identify the species, bring back the specimen and examine it, or classify it as "Sargassum juvenile" or "Filamentous microalgae". Decide in advance how to classify. Write the quadrat number on the plastic bag and put the creature to bring back there.

       It is useful for the scribe to record an approximate cross-sectional profile of the entire survey site for later reconstruction of the profile. It is also a good idea to record the position of the sea surface at the time of the lowest tide in the survey site profile.

      (4) Place the quadrat at an adjacent location along the line and make a similar score. This is repeated until the end of the survey line is reached.

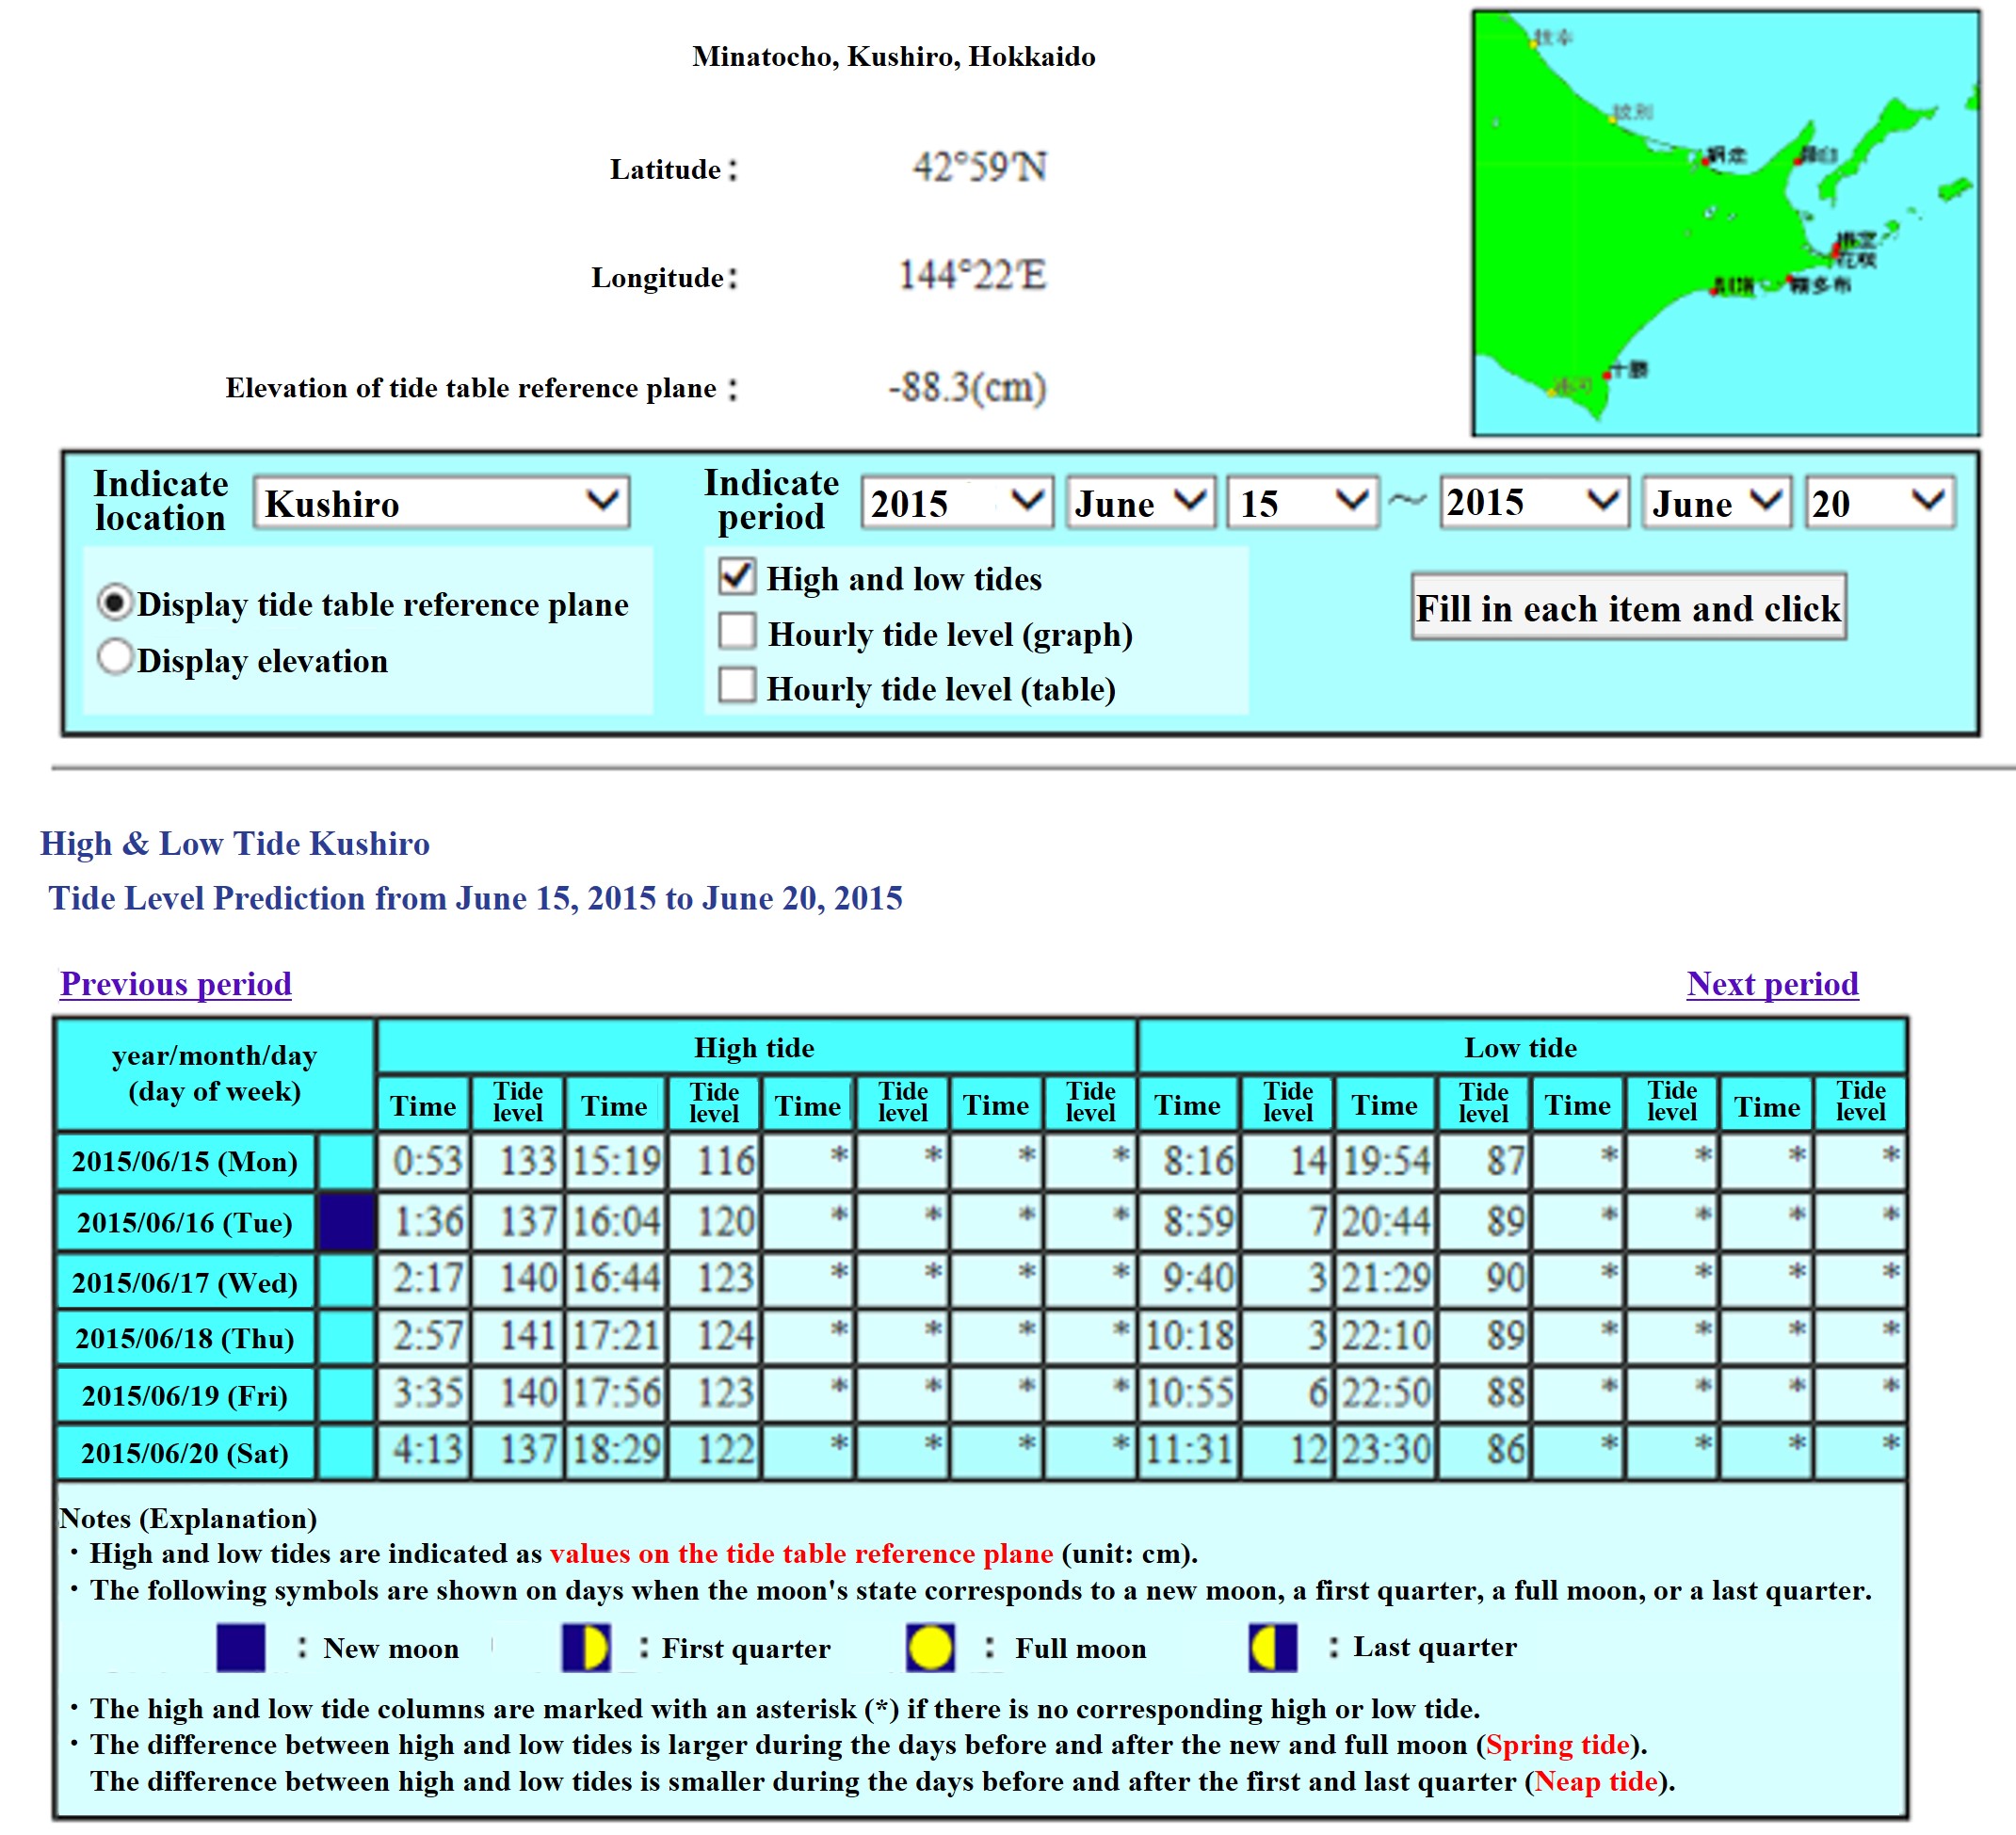
      (5) Check the time of low tide and tide level on the day of the survey, and record the actual sea level at that time on the line during the survey.


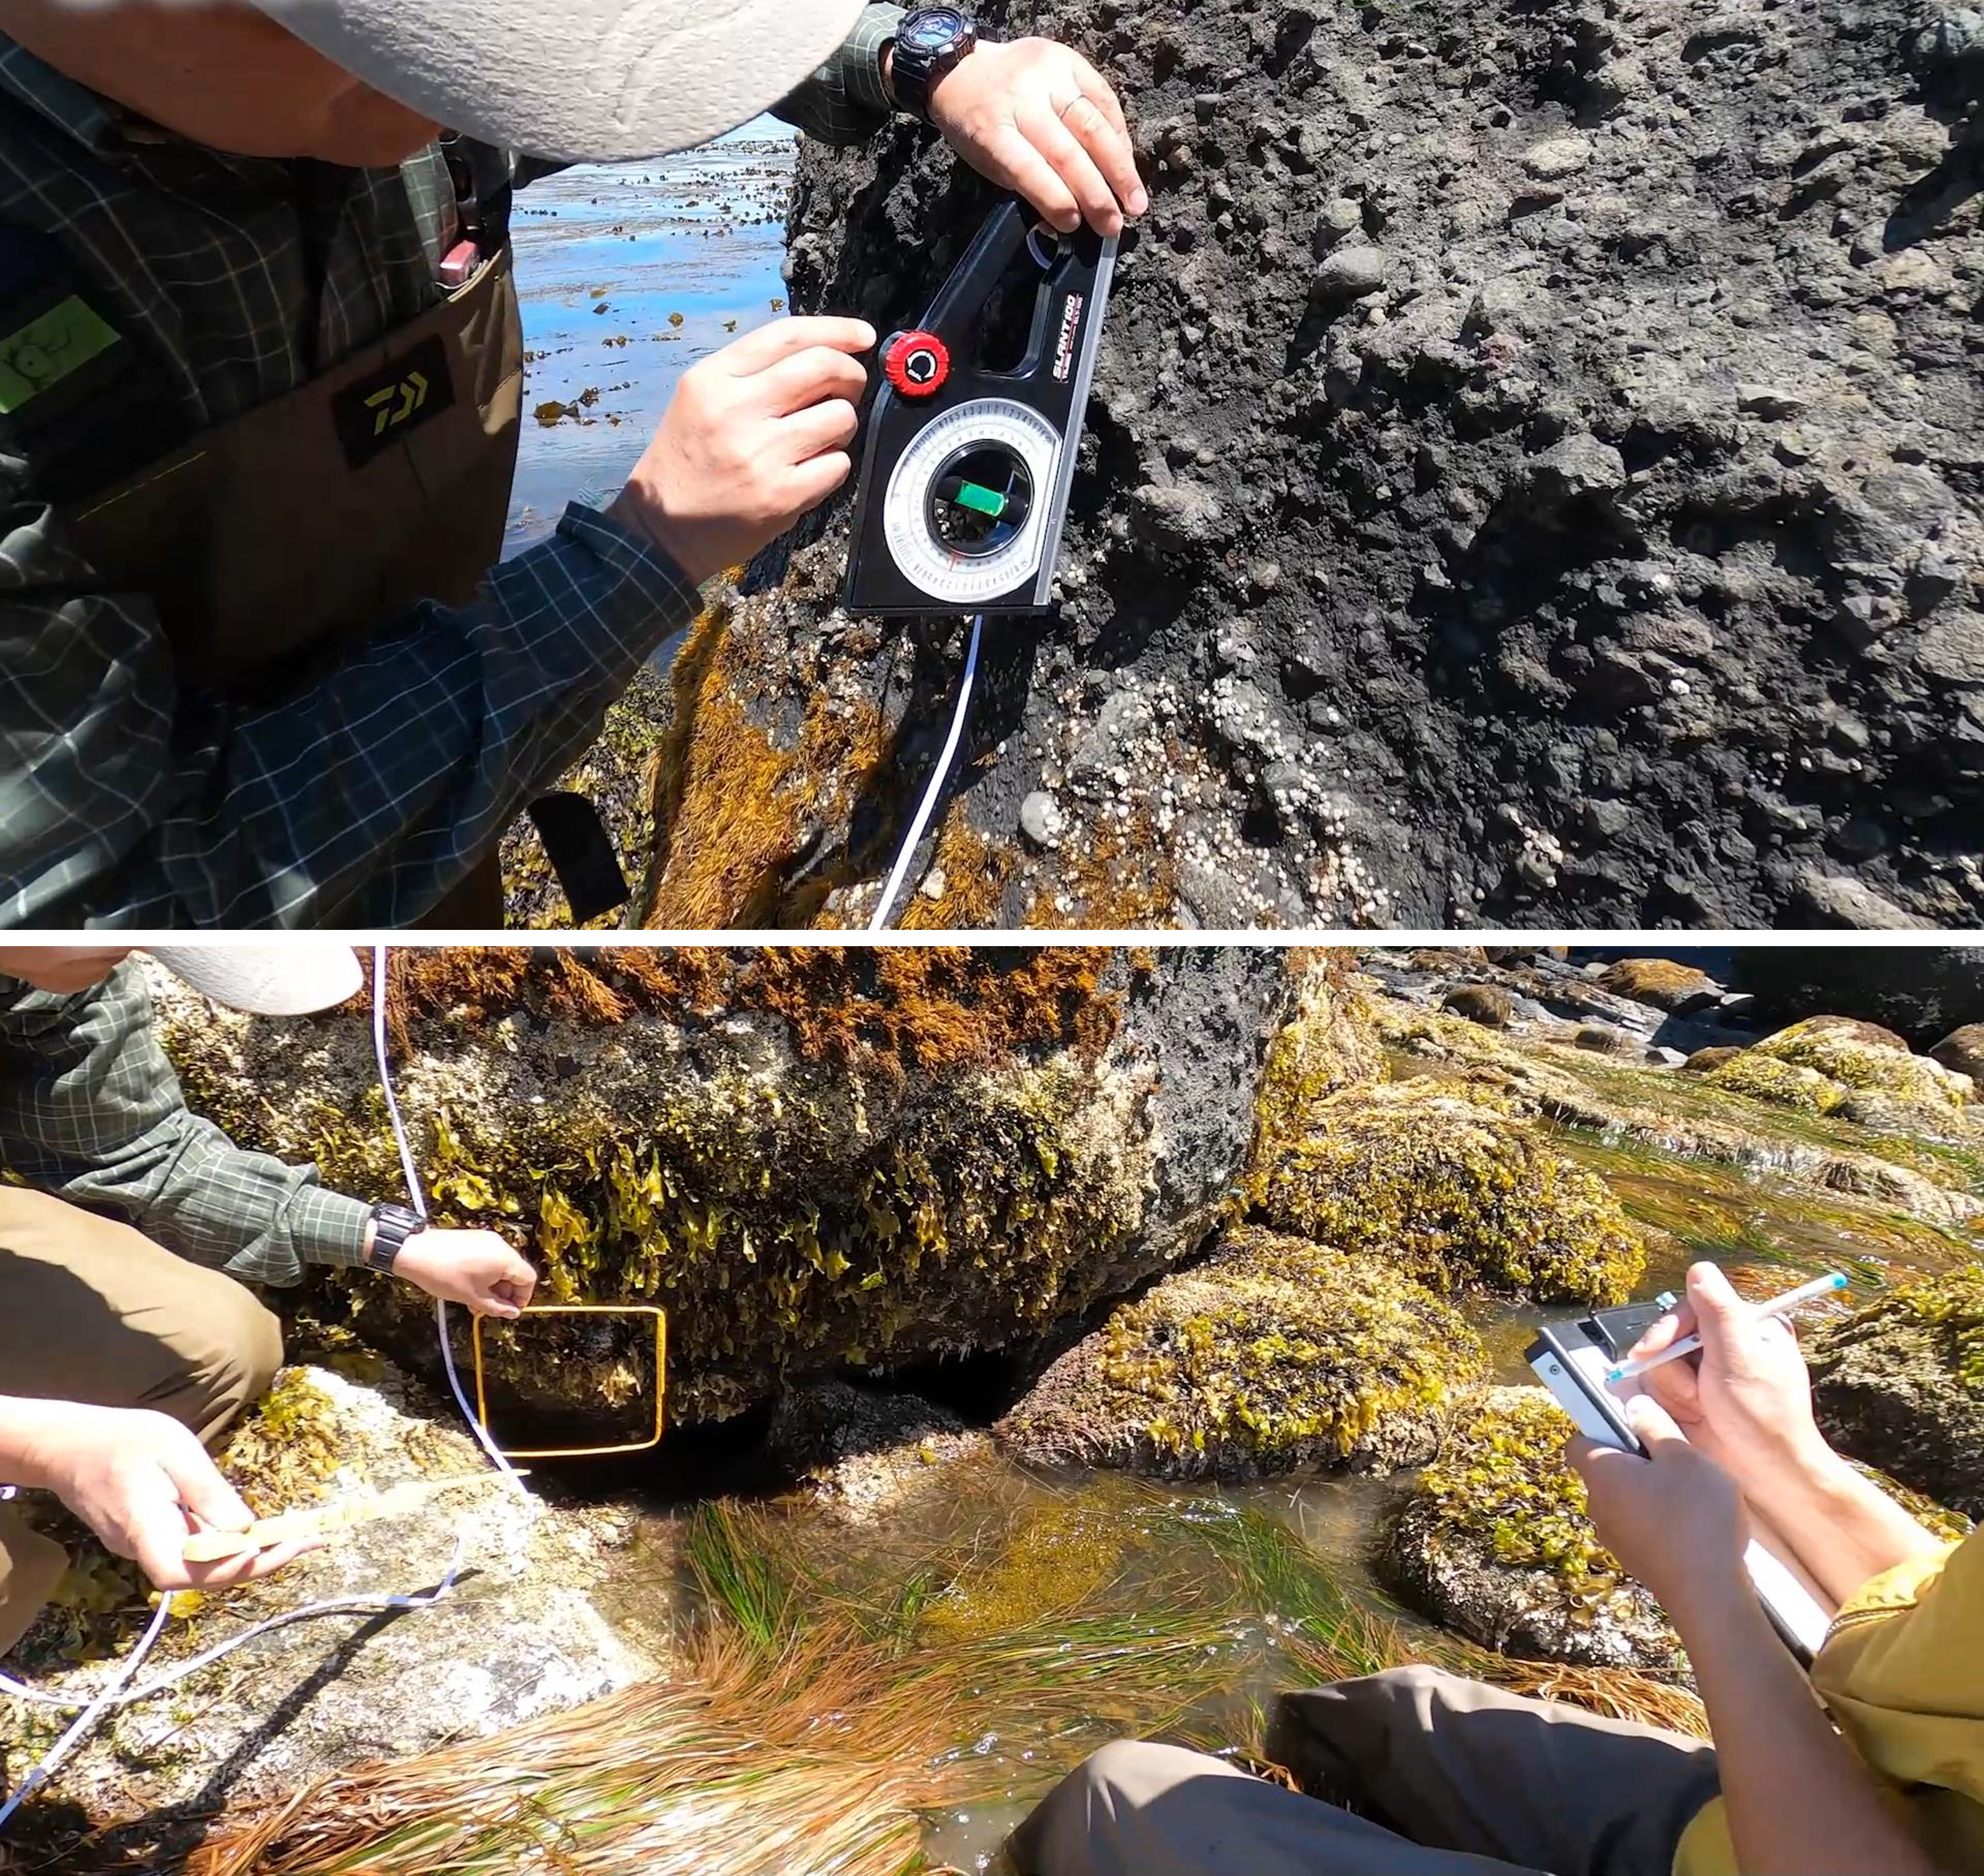
    • Fig. Investigation by belt transect method and zonal distribution of seaweed

    • Summary of results and presentation:

      (1)      The results of the vertical distribution survey will be summarized as a graph for each group, and each group will make a presentation on what can be said from the survey results using the graph.

      (2)       Based on the angles recorded in method (2), create a cross-sectional schematic diagram of the survey line (transect) using graph paper.

      (3)       The results of the survey (distribution of each organism) are shown in diagrams and graphs on the schematic cross-sectional view.

      (4)       Infer the environmental factors and the physiological characteristics of those organisms, and consider the results (from the survey results, what kind of tendency is there in the emergence of species, what factors are responsible for it, etc.). In doing so, it is advisable to pay attention to the lifestyle (body shape and life span type) of the emerging species.


      (5)       Each group presents an overview and discussion of the survey results while showing the created chart.

    • The part of the beach sandwiched between the high tide line and the low tide line (strictly speaking, the high tide line and the low tide line) is called the intertidal zone.
      This narrow band of no more than 2m wide (the number on the Pacific coast, this width varies depending on the region) is home to a surprisingly wide variety of organisms, most clearly recognizable in the rocky intertidal zone. The first feature of the intertidal zone is that it is submerged in the sea and exposed to the air due to the ebb and flow of the tides that occur twice a day, so it can be said that the organisms that inhabit it are forced to live both in water and on land. It is readily apparent that the higher up in the intertidal zone, the longer the exposure to air, the longer the biozone is exposed to dry conditions. Conversely, the lower you go, the longer you are submerged in the seawater, and the more moist the organisms will be.

      In this way, the intertidal zone has a remarkable gradient of environmental conditions from the upper part of the intertidal zone to the lower part of the intertidal zone. Each organism occupies a niche in the most favorable environmental conditions of the intertidal zone (of course, organism interactions also influence). As a result, they are distributed in a band shape with a narrow width (band-like distribution). A zonal distribution is seen in both seaweed and animals, with dry-tolerant species occupying the upper part of the intertidal zone, and plants and animals that prefer moist conditions are distributed in the lower part of the intertidal zone. In addition, it is considered that this zonal distribution structure is also affected by erosion pressure and wave strength.

    • Figure 2

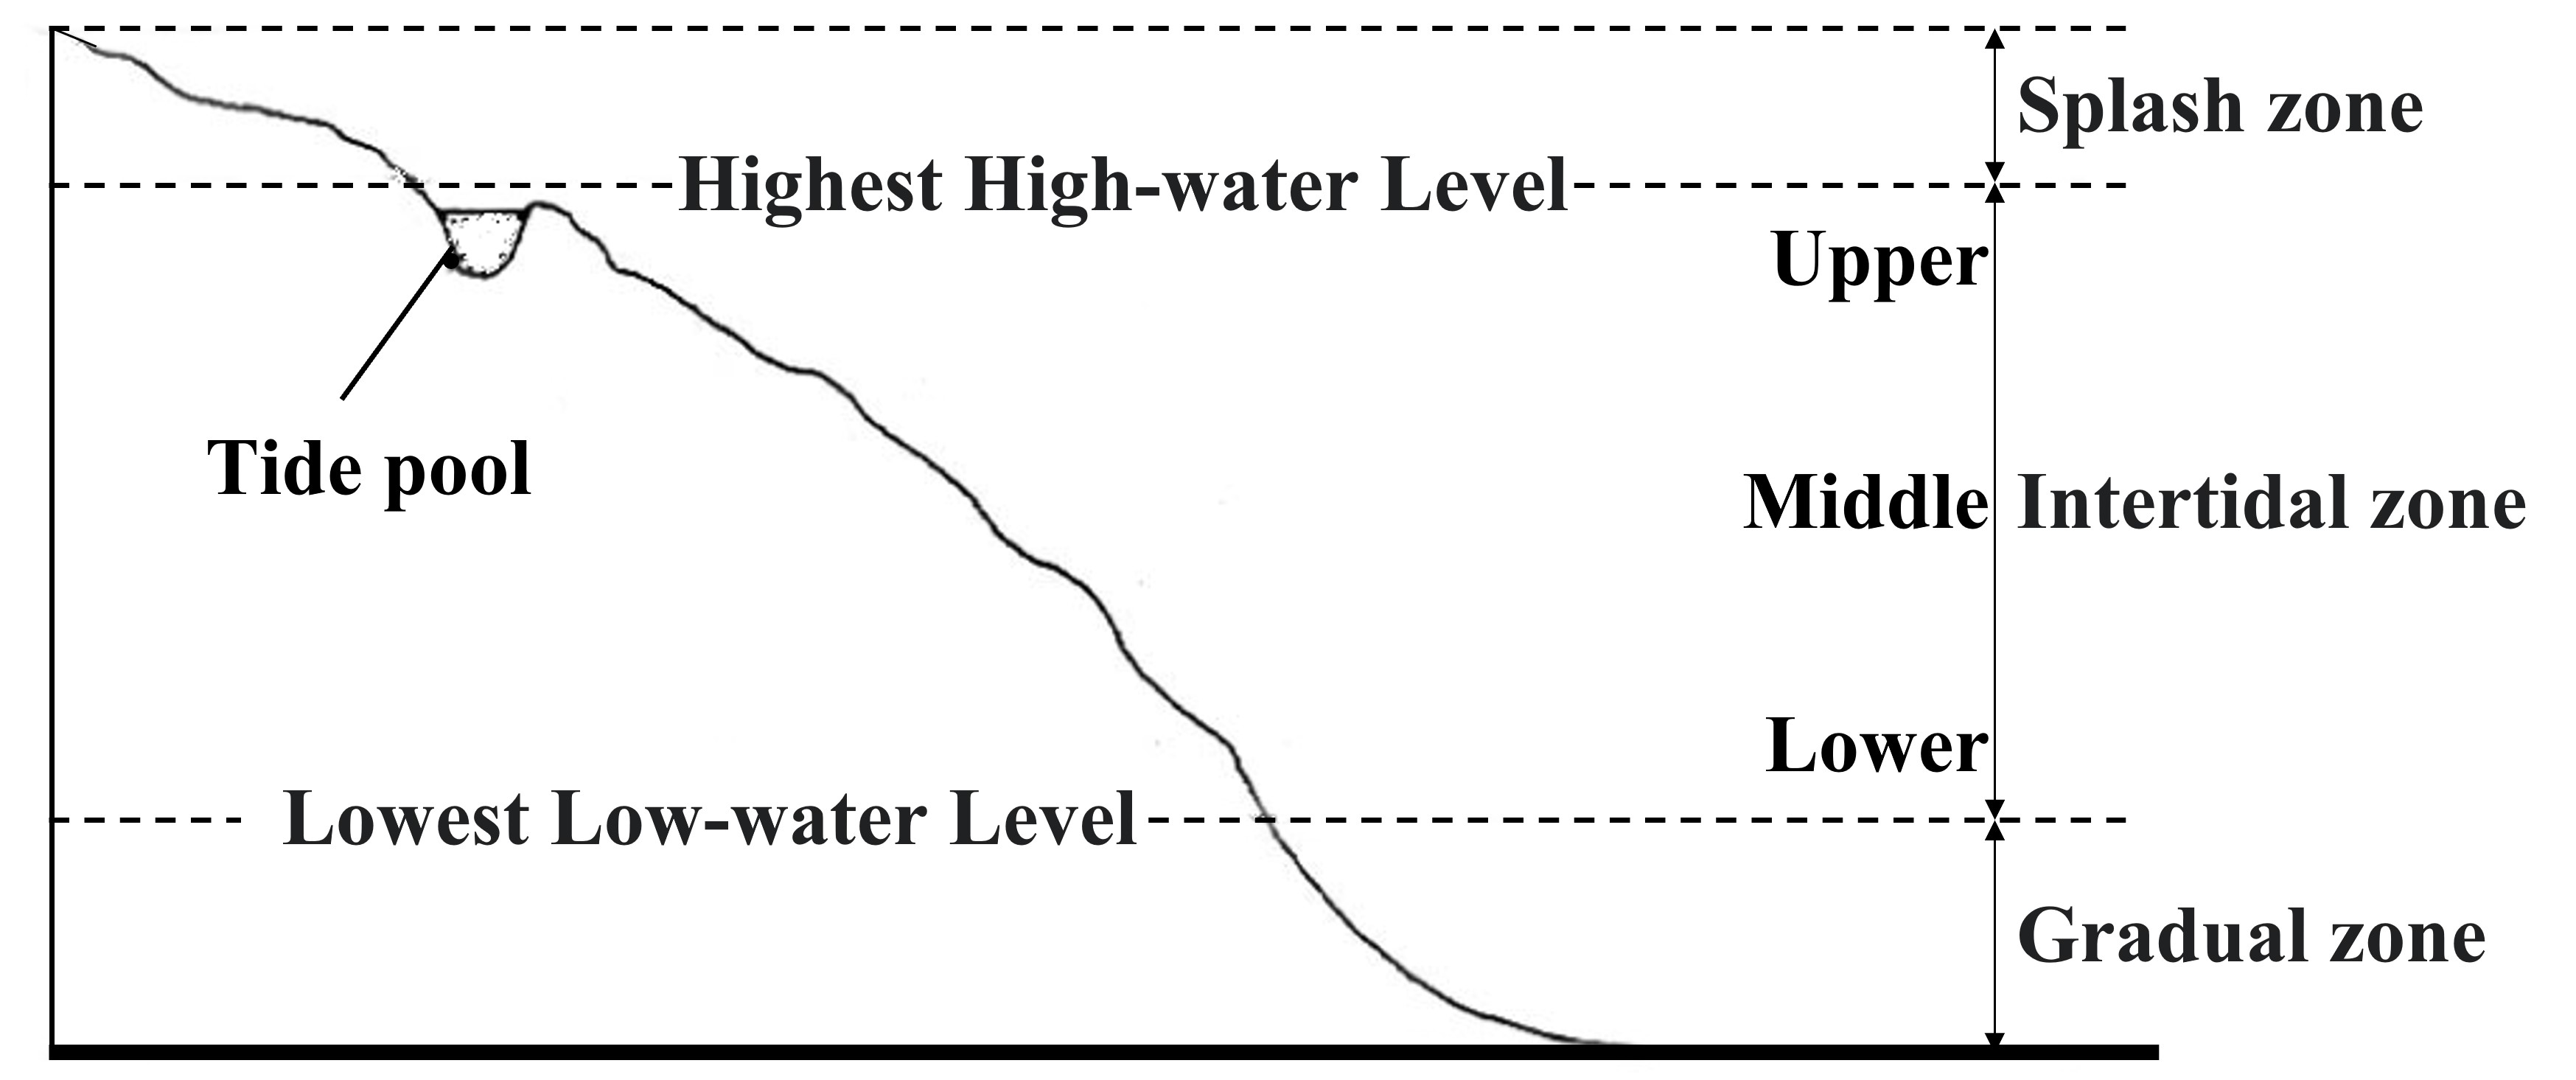
      Fig. Basically, seawater does not reach the upper part of the intertidal zone, but there are actually places where seawater splashes and is called the splash zone. The area below the lowest low tide line is not exposed to the air and is called the gradual zone.


    • When the tide recedes at low tide and the intertidal zone is exposed, large and small "ponds" appear in places where seawater is left behind in the hollows of the rocks. These are called tidal pools or tide pools. Tidepools also provide a unique living environment for organisms. Tide pools are always filled with seawater, but the environmental conditions are not stable. For example, during the hot summer months, the water temperature can reach nearly 40 degrees Celsius (although in Hokkaido it doesn't get that high...), and the water temperature can vary greatly throughout the day. Also, if there is a lot of rain, fresh water will flow in and the salinity will decrease, and if the weather is sunny, evaporation will increase the salinity. In this way, the tide pool seems to be a fairly harsh environment for living things, but there are also a wide variety of living things living there, so if you have the opportunity, please pay attention to such living things.

    • The main cause of tidal ebb and flow is the gravitational pull of the moon. This pulls the water toward the moon.On the other hand, the moon and the earth are attracted by each other's gravitational pull and rotate as one unit around the same axis, but because the mass of the earth is very large compared to that of the moon (about 100 times), the axis exists inside the earth. Rotation about this common axis creates a centrifugal force that pulls water away from the axis, ie, away from the moon. This attractive force and the centrifugal force are balanced, and eventually the seawater is pulled in both directions. Since the earth itself rotates, a point on the earth passes through points a-b-c-d in one day. This is why the tides come and go twice a day.


    • Figure 4

    • Furthermore, this gravitational-centrifugal relationship is also affected by the gravitational pull from the Sun, though not as strongly as the Moon. At full moon and new moon, when the moon, earth, and sun line up in a straight line, the gravitational pull from the sun is added, and the tide is often pulled. On the other hand, when the moon-earth-sun are aligned at almost right angles, their gravitational pulls cancel each other out and the tides do not recede much. Therefore, the degree and time of the tide vary depending on the season, topography, longitude and latitude, etc. Therefore, it is necessary to check the exact time of low tide and how low the tide will be in the local tide table or the weather column of the newspaper.

    • Figure 6


    • When the sun, earth, and moon are aligned, the difference between the tides is large (spring tide), and when they are aligned at right angles, the tide is low (neap tide).

    • Figure 7

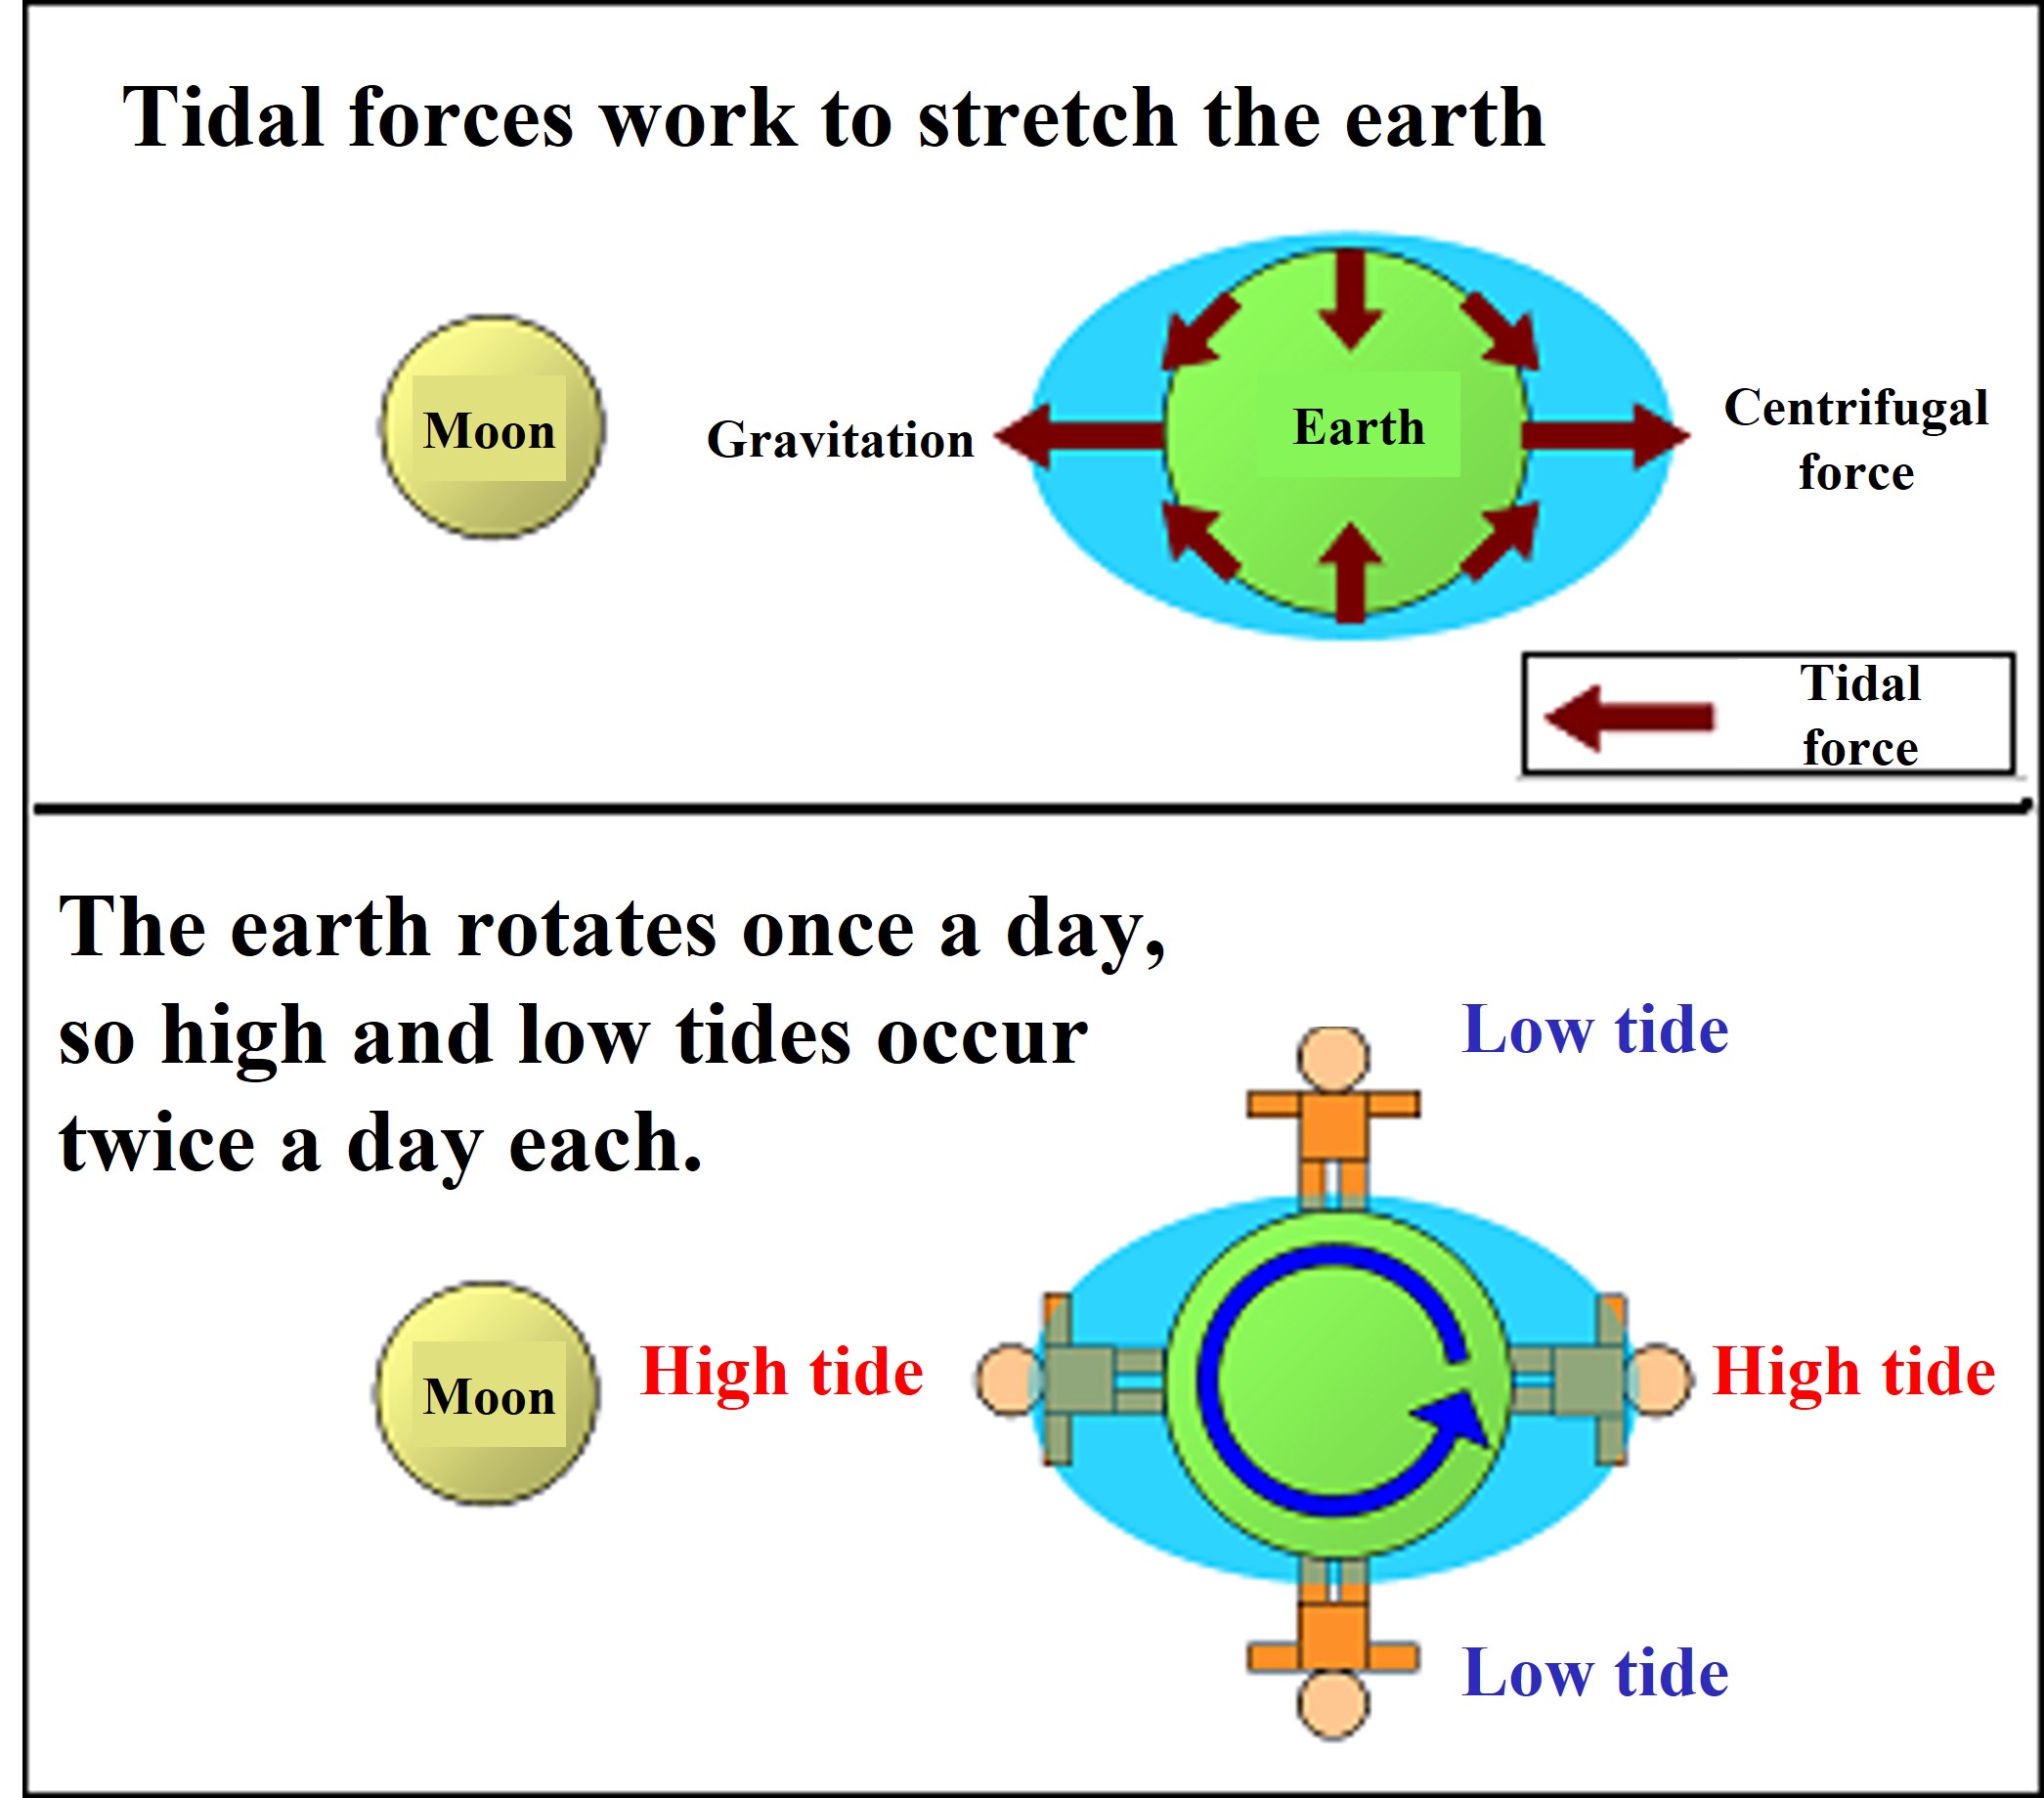
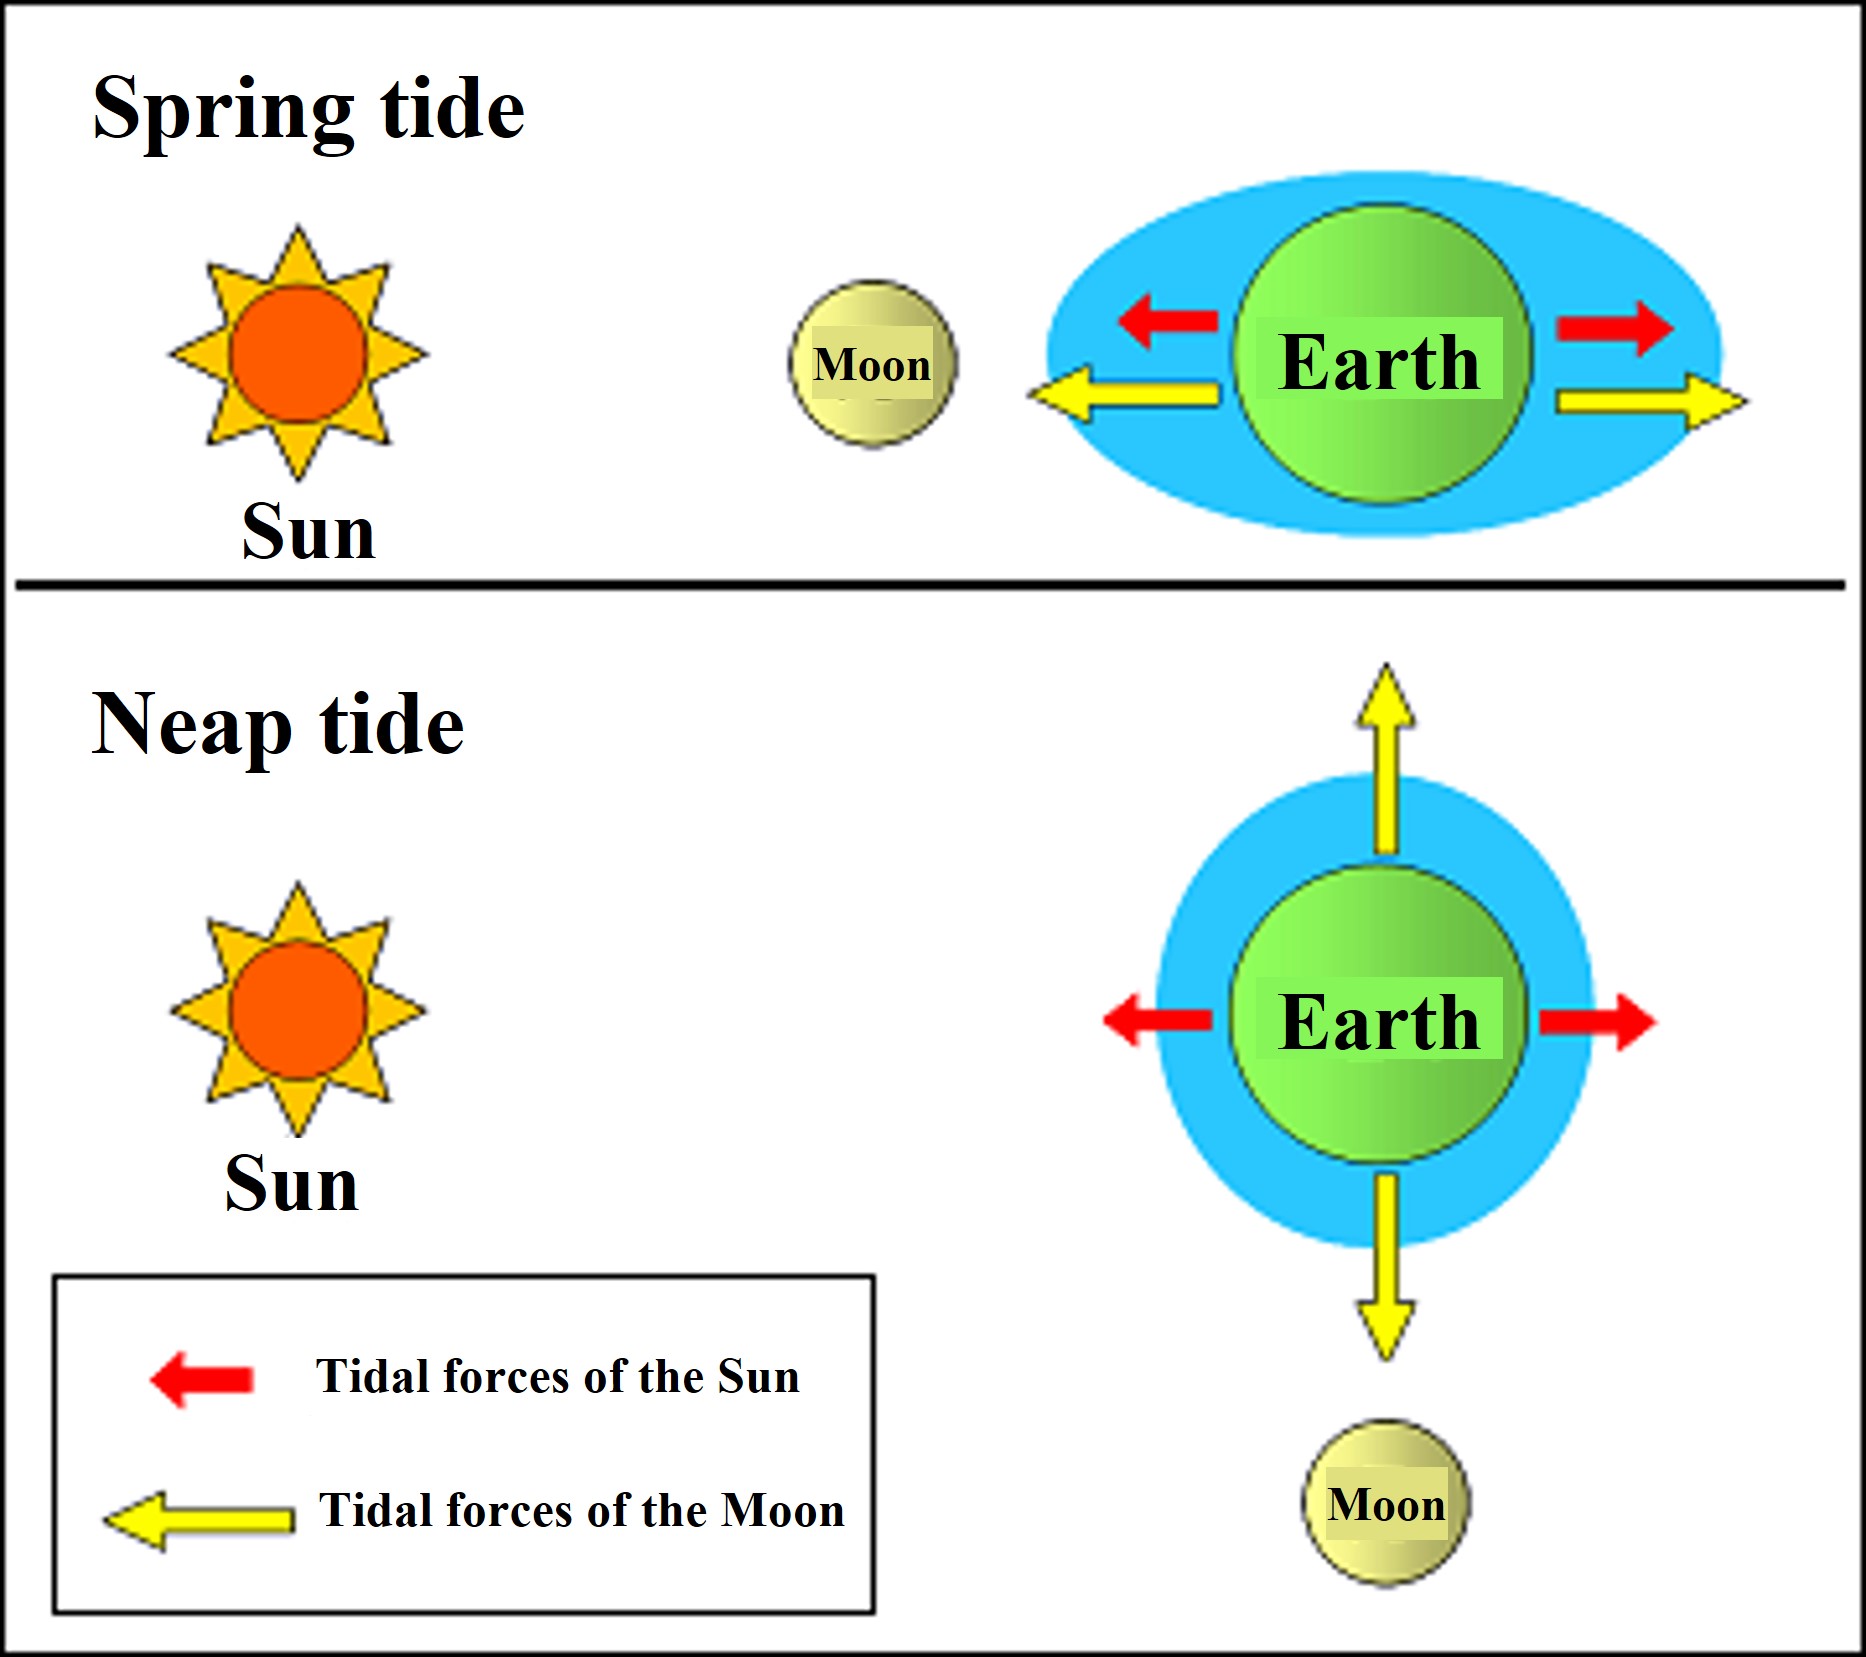
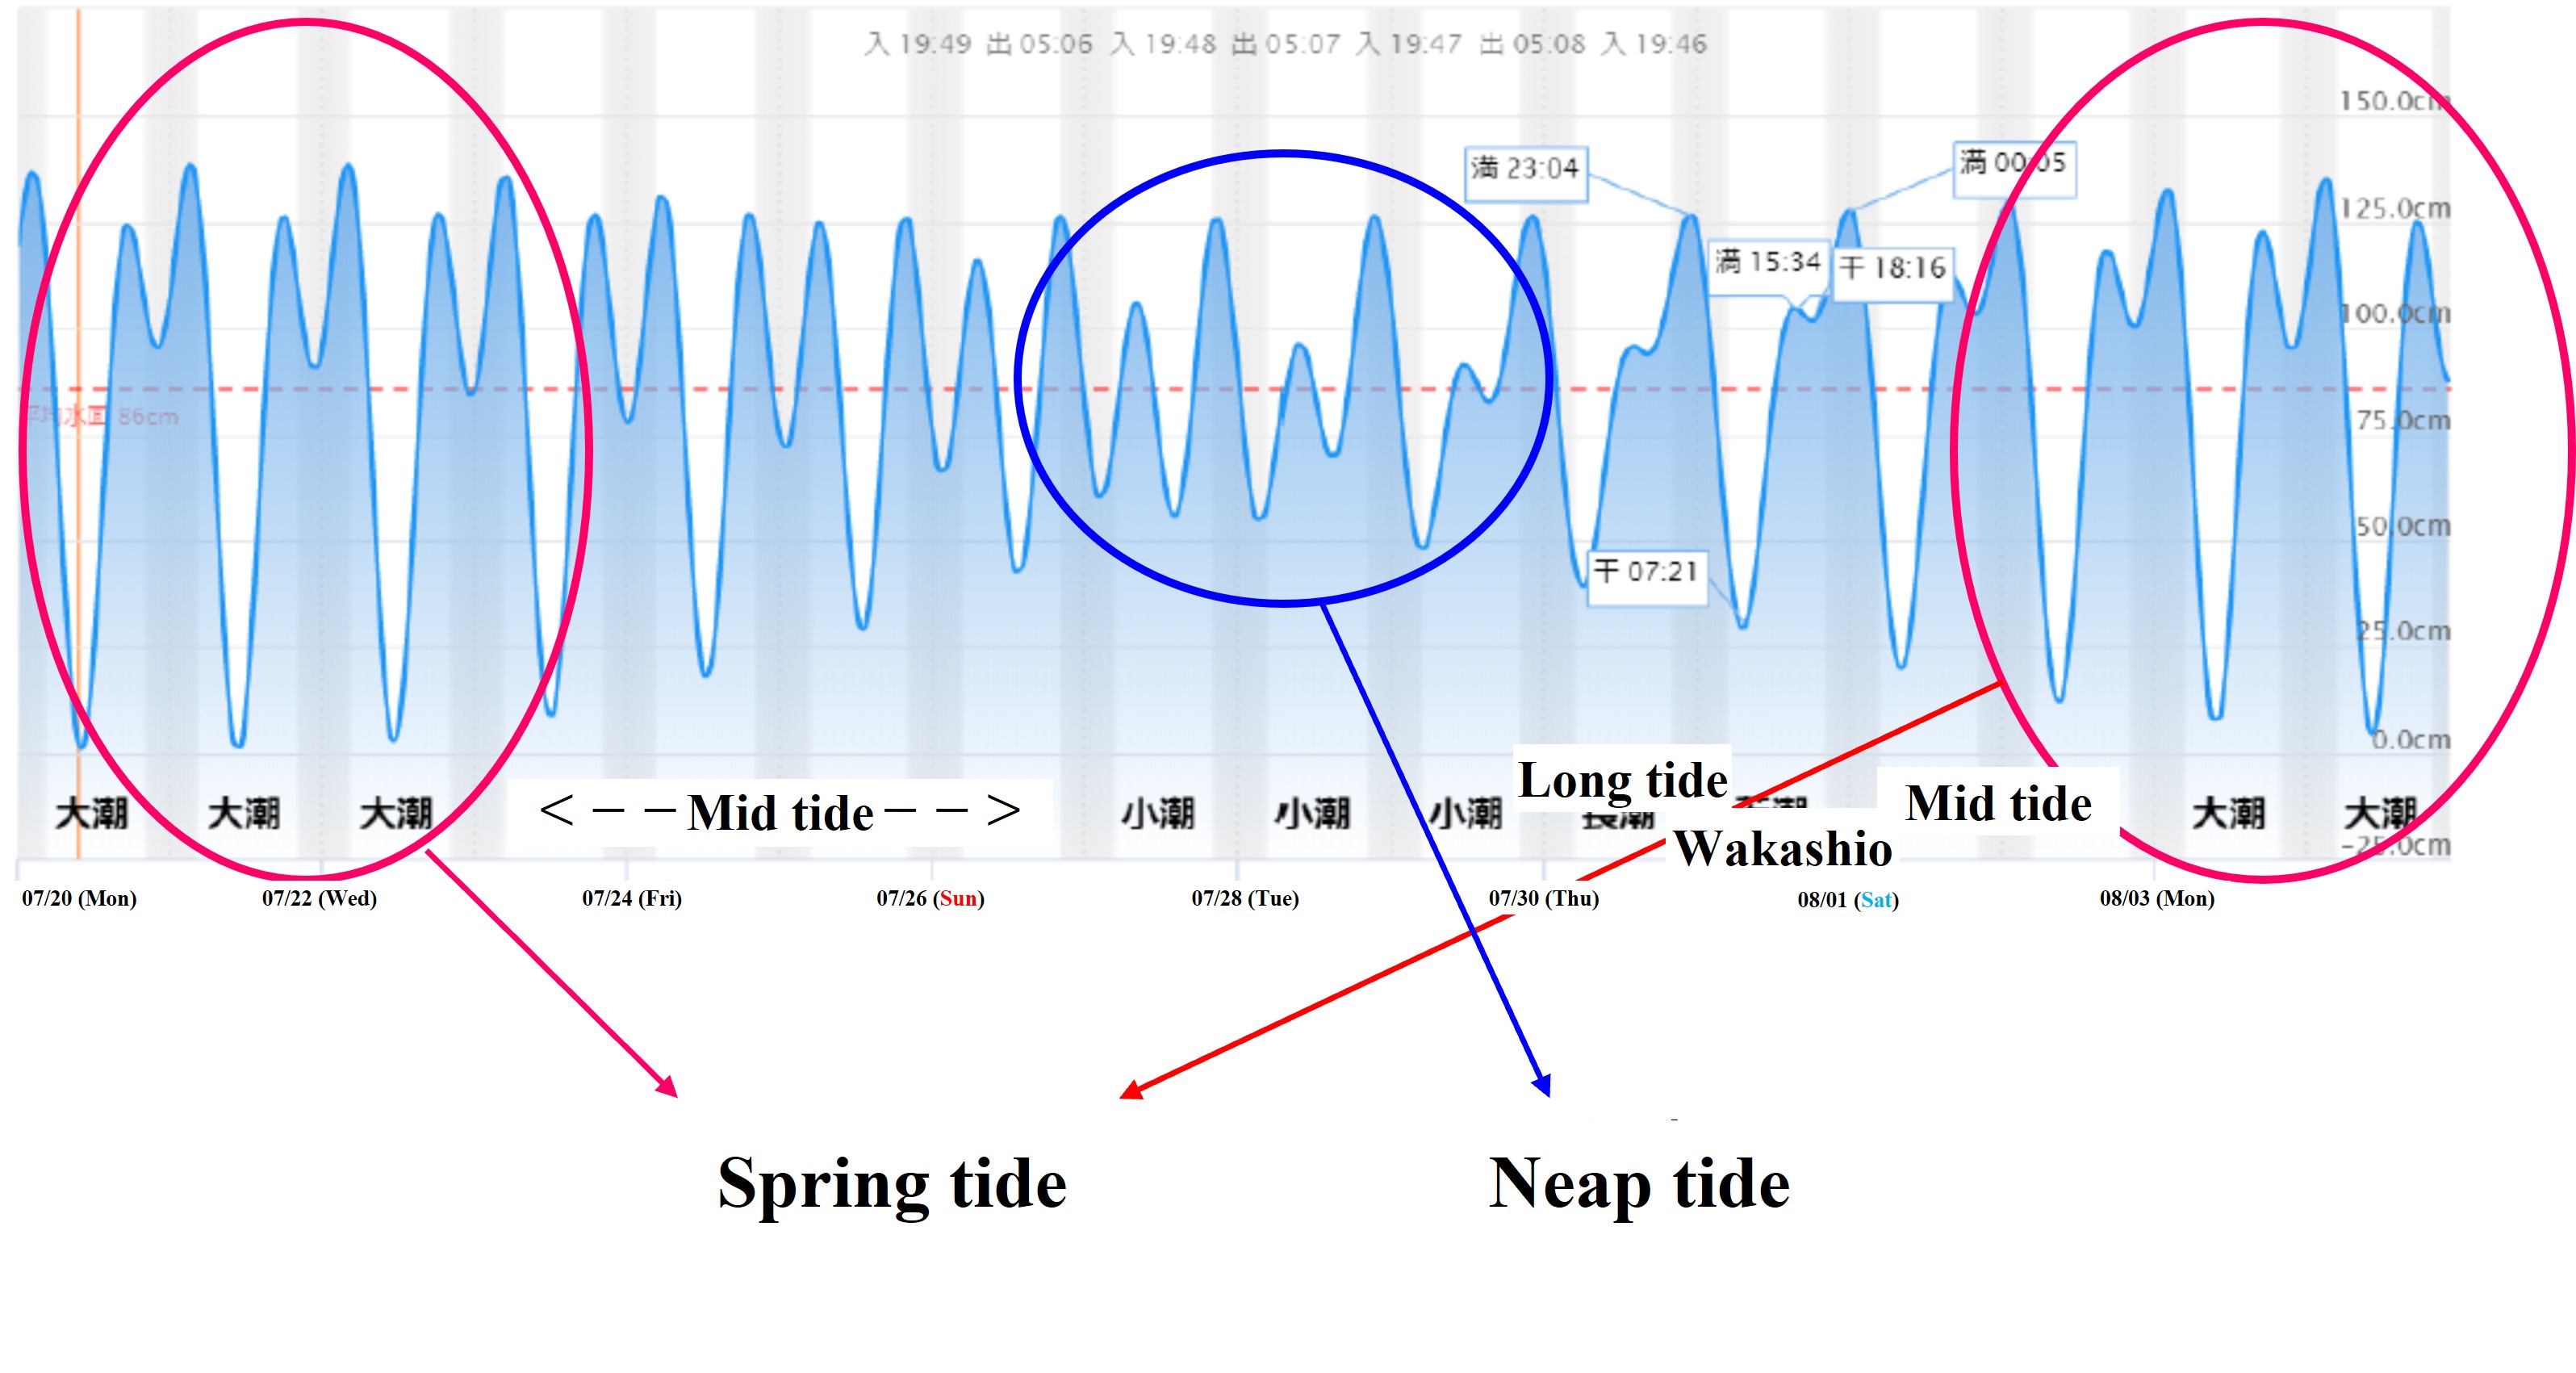
    • You can check the time and degree of high tide and low tide on the website of the Japan Meteorological Agency.


    • Figure 9

    • 【Commentary: From the Japan Meteorological Agency website】

      The tide table posted on this website is a summary of tide level forecast values ​​(astronomical tide levels) calculated based on analysis of past tide level data. Please note that this predicted value (astronomical tide level) differs from the actually observed value (measured tide level) due to various factors such as weather. For the values ​​observed in the past, please refer to the tide observation data. For the latest tide levels (yesterday, today, tomorrow's actual tide levels and astronomical tide levels), please see tide level observation information.

      The tide levels listed here are indicated by the tide table reference surface display (height from the tide table reference surface) and TP display (elevation) in cm. The tide table reference surface is different for each point. The elevation value of the tide table reference plane is posted at the top of the tide table list and the tide table page for each point.TP stands for Tokyo Bay Mean Sea Level, which is the standard for elevation. In addition, at some points such as remote islands, instead of the mean sea level of Tokyo Bay, the height standards of the Geospatial Information Authority of Japan and the MSL (mean tide level) are used. If you want to change the tide level value from the tide table reference plane display to the TP display, follow the instructions on the screen to switch the display. Please note that the value of "elevation of the tide table reference plane" is updated every year according to the reflection of survey results and changes in MSL (mean tide level). The display period is up to 5 weeks.

      All times are posted in Japan Standard Time (JST).

    • ○ About the ecology of reef intertidal zones

    • Unfortunately, it is on the list of out-of-stock books.

      You can purchase used copies on Amazon.com.