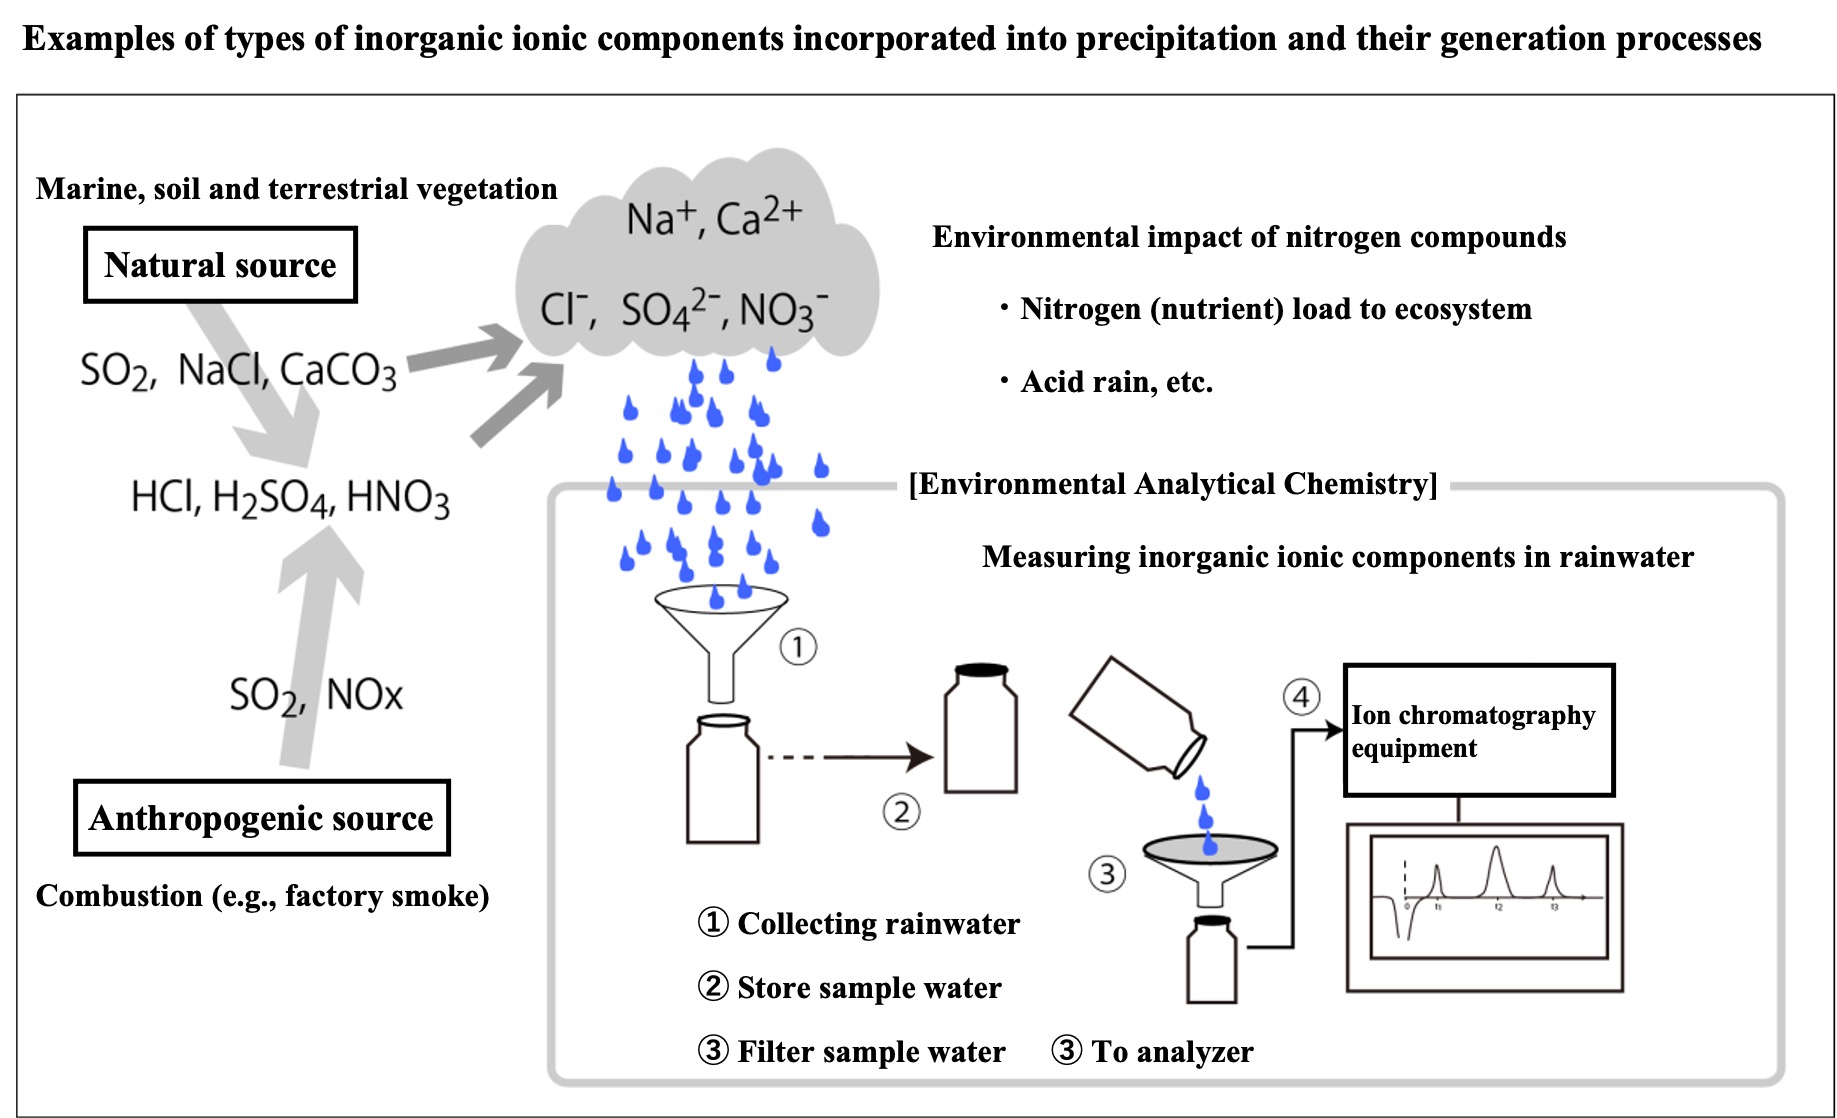
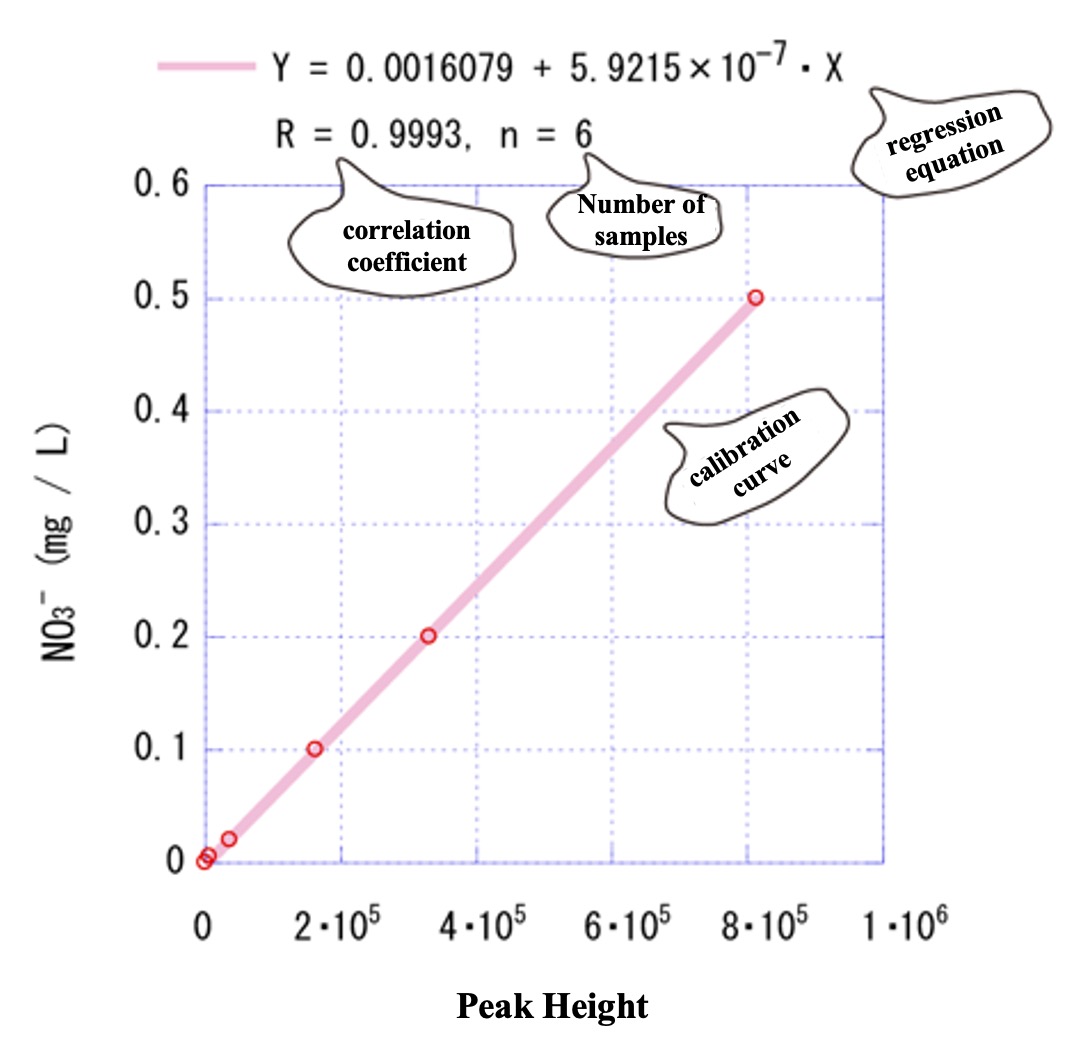
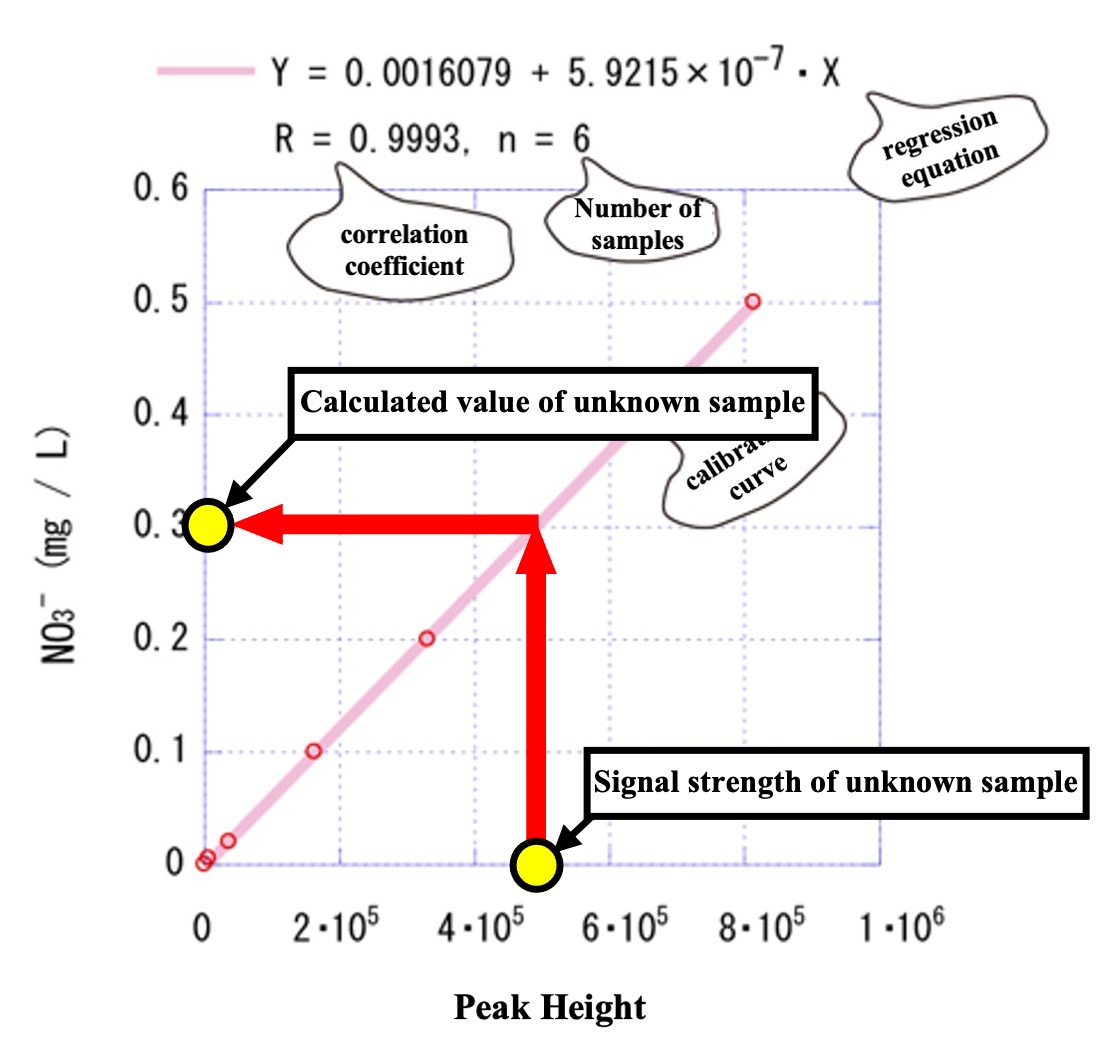
Example of Calibration Curve (1-1) Basic Question
টপিক সীমারেখা
-
-
We have also included a brief description of how to plot the calibration curve (regression curve) on the figure.
Please follow the instructions in A) and B) below in this excel file.
-
-
14.4 কেবি Excel 2007スプレッドシート Uploaded 18/04/23, 10:59
After downloading the Excel sheet, plot, make a calibration curve, and calculate the concentration of the unknown sample in Excel.
Please submit this excel sheet from ELMS (for Hokkaido University students only) for your analytical chemistry class.


