Perfilado de sección

    • 1. Ingestion experiment for mysids

       Five of the 20 individuals in the low-concentration group and three of the 20 individuals in the high-concentration group died during the experiment. Polyethylene beads ingested by the mysids differed significantly between treatments in both number (likelihood ratio test: χ² (1) =18.49, p < 0.001) and mass (χ² (1) = 15.61, p < 0.001). Mysids exposed to the high concentration ingested an average of 266.82 particles per individual (SD: 155.39) for a mean mass of 0.016 ng per mysid (SD: 0.016), a four-fold increase in particle number and six-fold increase in particle mass than mysids exposed to the low concentration, which ingested an average of 65.53 particles per individual (SD: 63.36) for a mean mass of 0.0026 ng per mysid (SD: 0.0028).


      2. Trophic transfer experiment

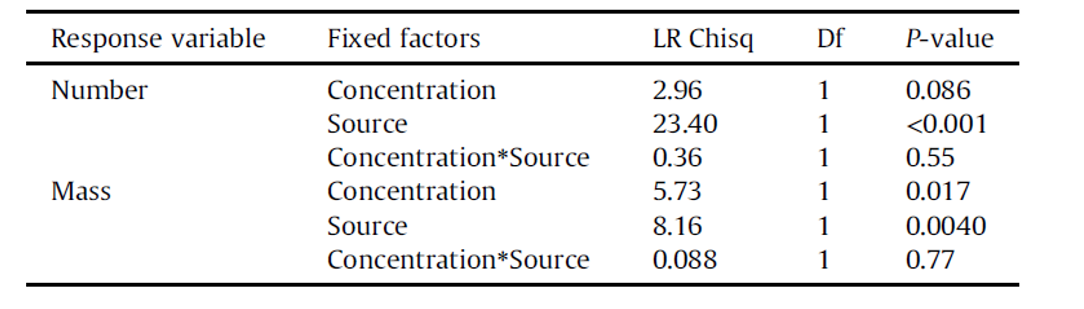
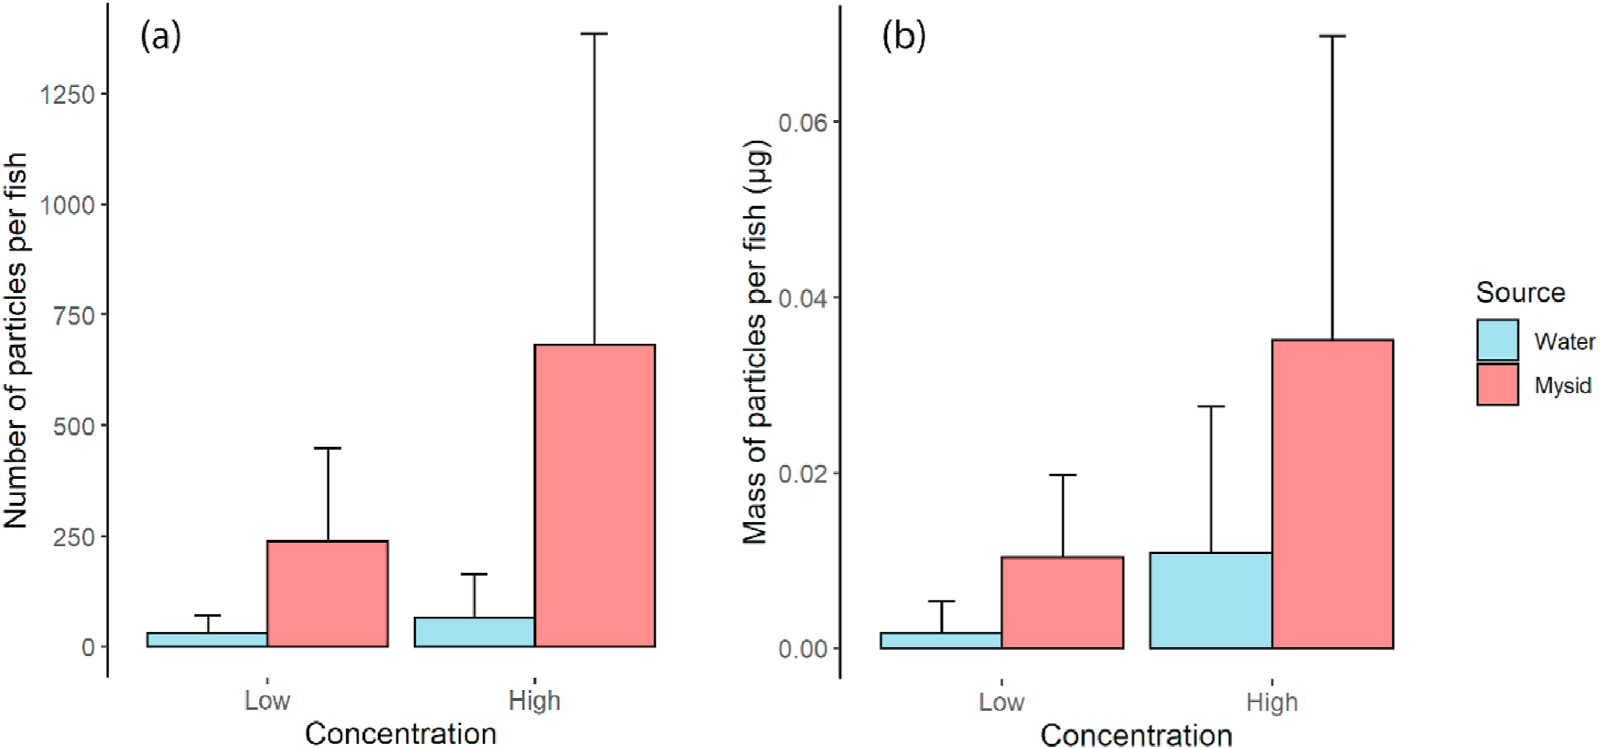
       The number and mass of polyethylene beads ingested by fish varied significantly in concentration and source (Table 1). On average, fish that ingested bead-exposed mysids ingested 8-11 times more particles (Table 1, Fig. 3a) and 3-5 greater mass than fish exposed to polyethylene beads in the water column (Fig. 3b). Fish exposed to the higher concentration of polyethylene beads ingested 2e3 times more particles and 3e6 times greater mass than those exposed to the lower concentration in both groups (fish fed bead-exposed mysids and fish in bead-containing water). There was no significant interaction between bead concentration and bead source (Table 1). Notably, the effect size of the source differed greatly between particle number (z [1, N = 15] = 0.01, p < 0.001, odds ratio: 13.62, confidence interval: 4.01, 40.15) and particle mass (t [1] = 0.13, p = 0.048, odds ratio: 4.20, confidence interval: 0.92, 15.53).


    • Table 1 Results of likelihood ratio test on the generalized linear model for the number and mass of polyethylene beads ingested by fish as functions of concentration and source.


    • 3. Size structure of polyethylene beads ingested by mysid and fish

       All mysids exposed to polyethylene beads contained fragmented beads (Fig. 1). Fragment frequency varied significantly between treatments (likelihood ratio test: χ² (4) = 186.88, p < 0.001). Multiple-comparison analysis revealed a significantly higher frequency of fragments in bead-exposed mysids and fish fed bead-exposed mysids than in the stock suspension, potassium hydroxide procedure blanks, or fish exposed from the water column (Fig. 4). The frequency of fragments did not differ between bead-exposed mysids and fish fed bead-exposed mysids. The frequency of fragments was higher in the potassium hydroxide procedure blanks and in fish exposed from the water column than in the stock suspension. The median particle sizes of bead-exposed mysids and fish fed bead-exposed mysids were 6.41 μm and 6.61 μm, respectively, whereas that of fish exposed from the water column was 32.40 μm.


    • Fig. 3. Average number (a) and mass (b) of polyethylene beads ingested by fish (Myoxocephalus brandti) from the water column or through ingestion of bead-exposed mysids. Bead concentration was 200 μg/L (low) or 2000 μg/L (high). Error bars represent the standard deviation.


    • Fig. 4. Frequency of polyethylene bead fragmentation in a stock suspension (SS), potassium hydroxide procedure blank (KOH), mysids exposed to polyethylene beads (Mysid), fish fed bead-exposed mysid (Fish_Mysid), and fish exposed to polyethylene beads in the water column (Fish_Water). Results are shown as box and whisker plots with median (solid horizontal line), interquartile range (25th and 75th percentiles; box), and the 10th and 90th percentiles (whiskers). Different letters denote significant differences by post-hoc comparison (p < 0.001, GLM with post-hoc Tukey’s HSD).