Perfilado de sección

    • 1.Animal collection

       We collected organisms for the experiment on November 7, 2018 at a seagrass bed in Akkeshi-ko estuary (43°02‘ N, 144°52‘ E), which is located in eastern Hokkaido, northern Japan. Mysids (Neomysis spp., wet weight: 20.9 ± 5.1 mg standard deviation) and juvenile M.  brandti  (wet weight: 6.5 ± 0.8 g standard deviation) were collected using an epibenthic sled. In this area, the mysids are major prey for predatory fish and decapod crustaceans; the fish are among the most dominant predators of mysids, especially at the juvenile stage (Yamada et al., 2010). We acclimated the animals in 30-L aquaria over 5 days with flow-through seawater that were filtered by fine sand to allow them clear possible microplastics from their guts. During the acclimation, we daily fed the mysids microalgae (Shellfish diet 1800; Reed Mariculture) and the fish fresh mysids. Each aquarium contained approximately 100 mysids or 20 fish.


      2.Microplastic exposure

       We used polyethylene microspheres (27-32 μm, 1.025 g/mL; Cospheric LLC, Santa Barbara, CA, USA) that were labeled with green fluorescence (excitation: 414 nm; emission: 515 nm). Global production of polyethylene exceeds production of other plastic polymers, and polyethylene is among the most common types of marine litter identified in the ocean. (Andrady, 2017; Beiras et al., 2018; Burns and Boxall, 2018; Hidalgo-Ruz et al., 2012). We selected this size as it is within the size range of phytoplankton (>10 µm) that mysids feed on (Bowers and Grossnickle, 1978). Fluorescently labeled microbeads were used to distinguish them with any possible contaminated plastics during the experiments so that the results would not be interfered. 
       A glass beakerwas filled with 10 mL of distilled water and boiled in a microwave. Ten microliters of surfactant (Tween 80; polyethylene sorbitol ester, Cospheric LLC) were added and stirred with a glass rod for 30 s. Next, 1 mL of the solution was transferred to a 1.5-mL Eppendorf tube and left at room temperature for 1 h. Following the addition of 50 mg of fluorescent microbeads, the tube was vortexed and the solution was then diluted 100-fold with distilled water. The final concentration of polyethylene beads in the stock suspension was approximately 24 μg or 1770 particles per 10 mL of suspension stock. To determine that the mysids could ingest the polyethylene beads, we exposed mysids to 2000-mg/L beads. Fluorescent microscopy showed polyethylene beads in the animals’ stomachs, intestines, and fecal pellets (Fig. 1).


    • Fig. 1. Fluorescent stereomicroscope images of polyethylene (PE) beads ingested by Neomysis spp. in (a) stomach, (b) intestine, and (c) fecal pellet. (d) Beads isolated from a mysid. FB, fragmented beads; WB, whole beads.


    • 3. Ingestion experiment for mysids

       We conducted a microplastic ingestion experiment on November 12 and 13, 2018. Forty three 1-L plastic bottles were filled with filtered seawater; three bottles contained no microplastics (control), 20 bottles contained 200-μg/L microplastics (low dose), and 20 bottles contained 2000-μg/L microplastics (high dose). The low dose was chosen as an environmentally relevant concentration as it is within the same order of magnitude of the microplastic concentration reported in the North Pacific Subtropical Gyre, which is among the most heavily contaminated area around the world (Goldstein et al., 2012). High dose was set as the future concentration in the scenario that microplastic pollution in the North Pacific Ocean keeps growing over the next 50 years (Isobe et al., 2019). We randomly selected adult mysids without juveniles in their brood pouch and placed one in each bottle.We then fed the mysids 2 mg (dry weight) of microalgae. We constantly circulated the seawater by aeration to ensure that the microplastics were evenly distributed in the bottles. After 24 h of microplastic exposure, the mysids were flushed gently with filtered seawater to remove beads from the exoskeleton. Following measurement of their wet weight, themysids were dissected to remove the stomach and intestine, which were fixed with 70% ethanol and stored in glass vials until analysis.


      4. Trophic transfer experiment

       We conducted a microplastics trophic transfer experiment on November 14e17, 2018. We controlled two factors: the concentration of microplastics (200 or 2000 μg/L) and the source (water or mysids) (Fig. 2). Thirty-three glass aquaria were prepared, and one fish was assigned to each aquarium and kept without food for 48 h prior to the experiment. In three of the aquaria, each fish was fed only nine plastic-free mysids (control). Five aquaria contained water with a 200-μg/L microplastic suspension and nine plasticfree mysids each, so that the fish would ingest polyethylene beads only from the water column. Five other aquaria contained water with a 2000-μg/L microplastic suspension and nine plasticfree mysids each. Ten aquaria each contained nine mysids that had been pre-exposed to 200-μg/L microplastics, and 10 aquaria each contained ninemysids that had been pre-exposed to 2000-μg/ L microplastics. We allocated more replicates to the mysids group because the experimental space was limited and the higher variability was expected in this group due to the variation in the amount of microplastics ingested by mysids. The 20 aquaria containing pre-exposed mysids were filled with filtered seawater without a microplastic suspension so that uptake of polyethylene beads would be solely from the food source. The number of mysids was determined from a preliminary experiment to ensure that all mysids were consumed by the fish within 24 h. Pre-exposure of the mysids followed the protocol for the first experiment, except that three individuals were placed in each exposure bottle. We constantly circulated the seawater by aeration throughout the experiment to ensure that microplastics were evenly distributed in the aquaria.We did not observe any microplastics on the bottom of the tanks throughout the experiment.We confirmed that allmysids were consumed within 1 h. After 24 h, the fish were gently flushed with filtered seawater to remove beads from the body surface. Following measurement of their wet weight, the fish were dissected to remove the stomach and intestine, which were fixed with 70% ethanol and stored in glass vials until analysis.


    • Fig. 2. Experimental design of trophic transfer (Experiment 2). Control fish were not exposed to microplastics through the water column or food. Fish_Water denotes fish fed plastic-free mysids and exposed to polyethylene (PE) beads suspended in the water column for 24 h. Fish_Mysid denotes fish fed mysids that had been pre-exposed to PE beads but the aquarium water did not contain a microplastic suspension. 


    • 5. Sample analysis

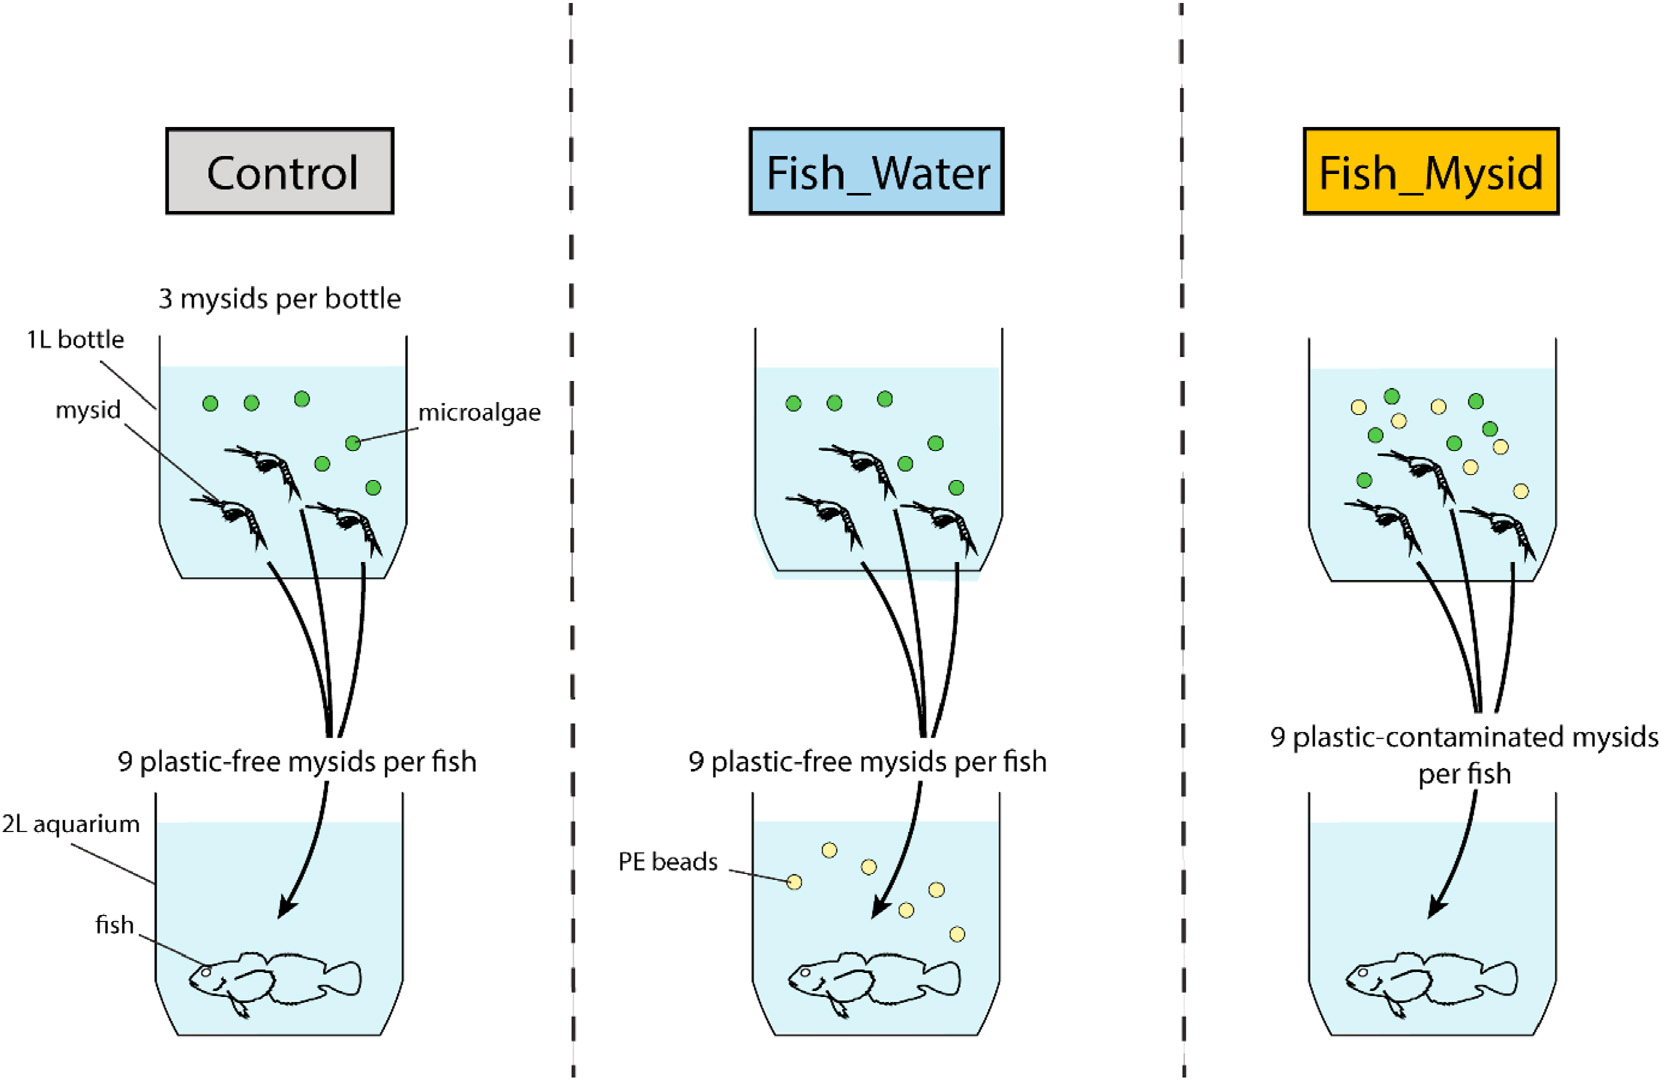
       To extract polyethylene beads ingested by the animals, the stomachs and intestines of mysids or fish were placed in 1.5-mL microtubes with 1 mL of 10% potassium hydroxide solution to dissolve organic matter. We also treated the stock suspension withpotassium hydroxide or distilled water as procedure blanks to examine the treatment effects on polyethylene beads. The samples were shaken at 60 rpm at room temperature for more than 1 week. 
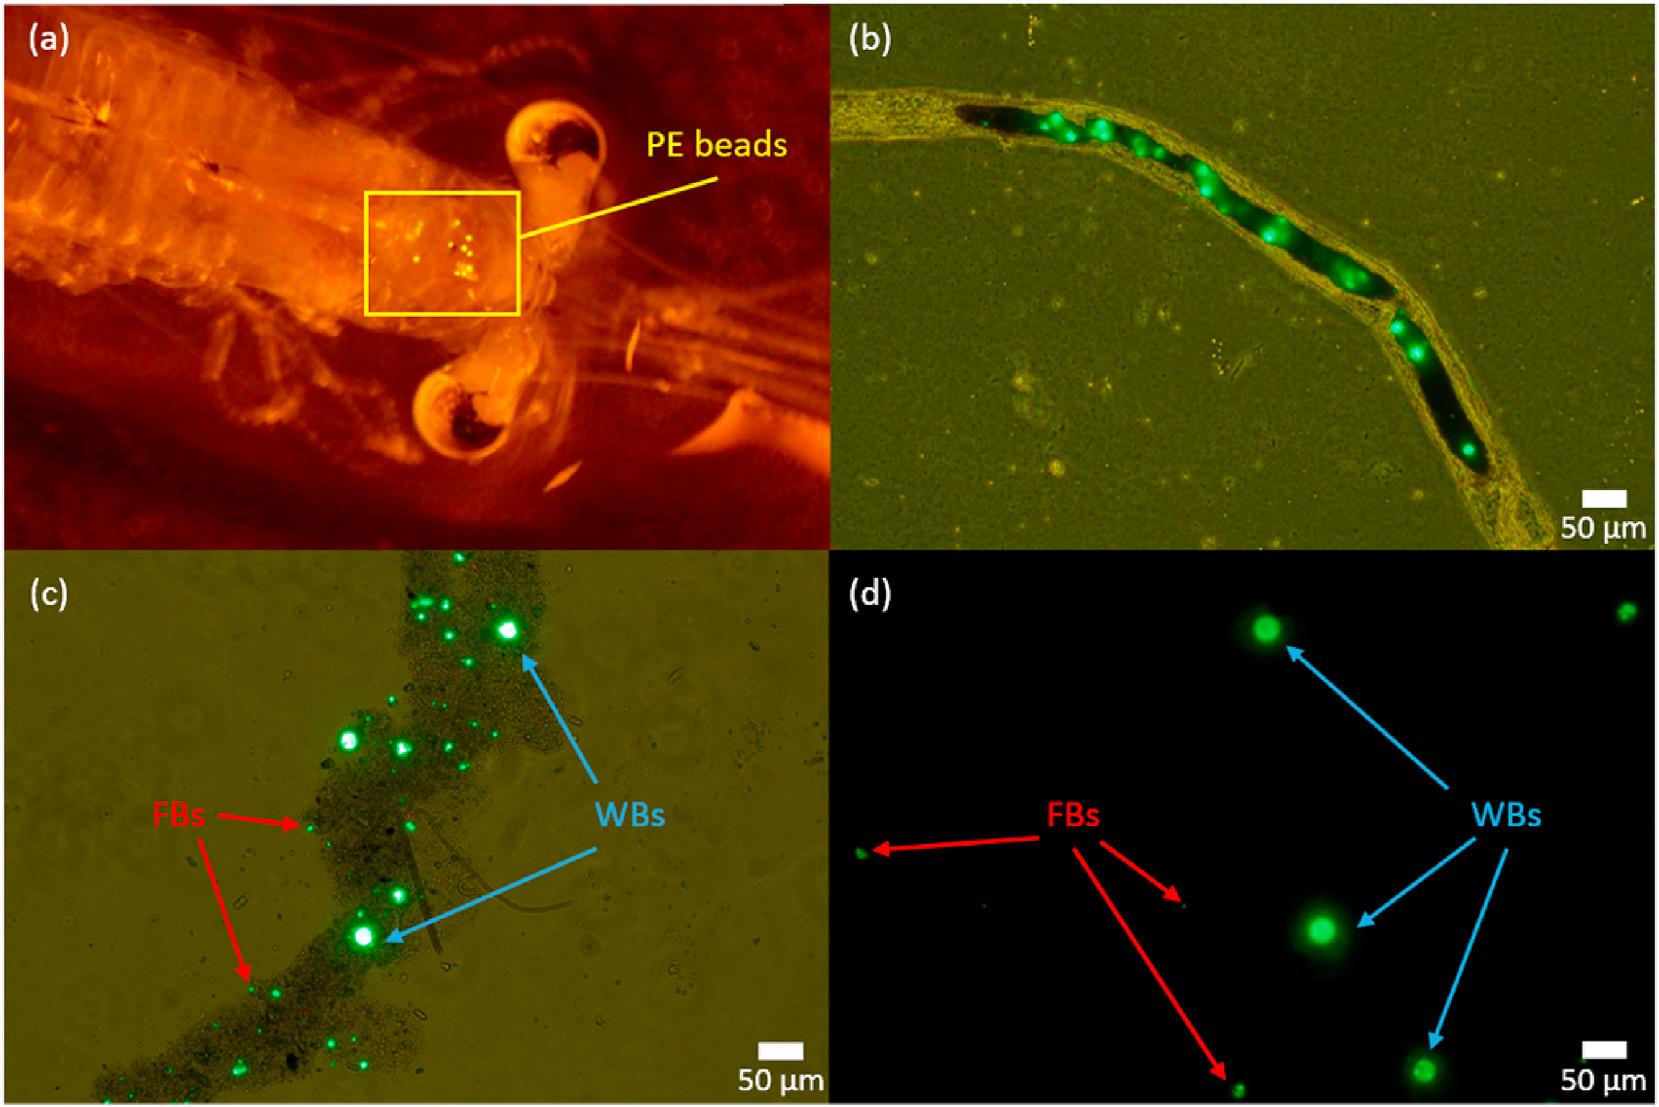
       After all the organic matter was dissolved, the remaining samples were filtered under vacuum through nylon mesh filters (MilliporeSigma, Burlington, MA, USA; nylon membrane hydrophilic filter, pore size: 0.8 mm, filter diameter: 25 mm). The microtubes and funnels were washed three times with 70% ethanol to recover all beads. Next, the filters were fixed between glass slides and the number and size of polyethylene beads were determined under a fluorescent microscope (CKX53; Olympus Corporation, Tokyo, Japan) at 100 × magnification. All particles on the filters were individually imaged and analyzed. For fish intestine samples, the images were taken from 30 randomly selected squares (1.76 × 1.32 mm) on the filter, accounting for approximately 25% of the total filtered area (2.9 cm²), because a substantial number of particles was found. We then estimated the total amount ingested. 
       The diameter (major axis when a particle was fitted to an ellipse) of each particle within each image was measured using ImageJ software (NIH, Bethesda, MD, USA). We applied thresholds to the fluorescence intensity of each image with the “Intermodes” algorithm, which enabled the exclusion of undigested materials on the filter without interfering with the analysis. Particles larger than 50 μm were excluded from the analysis on the assumption that more than two beads had aggregated. The minimum size threshold was designated as 2.43 μm because the software could not distinguish smaller beads from noise, leading to a final particle diameter range of 2.43-50 μm. Additionally, we determined the number and mass of the ingested particles. Assuming that all particles were ellipsoids, we calculated the mass by the major axis, the minor axis, and the density (1.025 g/mL). We determined the size boundary between whole and fragmented beads as 25 μm (major axis) from the particle size distribution in the stock suspension, and then calculated the fragment frequency by the percentage of fragmented beads against the total number.


      6. Statistical analysis

       No polyethylene beads were found in the control groups, so we excluded them from the statistical analyses. All analyses were conducted in R (R Core Team, 2020). Data are presented as mean ± standard deviation (SD). 
       To compare the differences in the number and mass of polyethylene beads ingested by mysids, we used generalized linear models (GLMs) with log link functions. For particle numbers, a negative binomial distribution was assumed to account for the overdispersed discrete values using the ???. nb function in the “MASS” package (Venables and Ripley, 2002). Overdispersion for the model was checked with the dispersiontest function in the “AER” package (Kleiber and Zeileis, 2008) assuming that the response variable had a Poisson distribution. For particle mass, because the Shapiro-Wilk normality tests showed that the response variable had a non-normal distribution, a gamma distribution was assumed to account for the positive continuous values. We used log-transformed mysid wet weight as an offset in the models. To test the effect of concentration, we performed a likelihood ratio test using the Anova function in the “car” package (Fox and Weisberg, 2019). 
       To compare the differences in the number and mass of polyethylene beads ingested by fish, we used GLMs with log link functions. A negative binomial distribution and a gamma distribution were assumed for particle number and mass, respectively. We used log-transformed fish wet weight as an offset in the models. We tested the single and interaction effects in the models by the likelihood ratio test. To address the effect sizes betweengroups, we report odds ratios with 95% confidence intervals calculated from the estimates and standard errors of the slopes in the models. 
       To compare the difference in fragment frequency between treatments (stock suspension, potassium hydroxide procedure blank, mysids, fish fed bead-exposed mysids, and fish exposed to waterborne beads), we applied a GLM with a log of the total number of beads as an offset assuming a negative binomial distribution. Following the likelihood ratio test for the treatment effect, we used Tukey’s HSD test as post-hoc analysis for pairwise comparisons. Data from the low and high concentration treatments were grouped together in this analysis.