Calculate the change in the 14C ratio
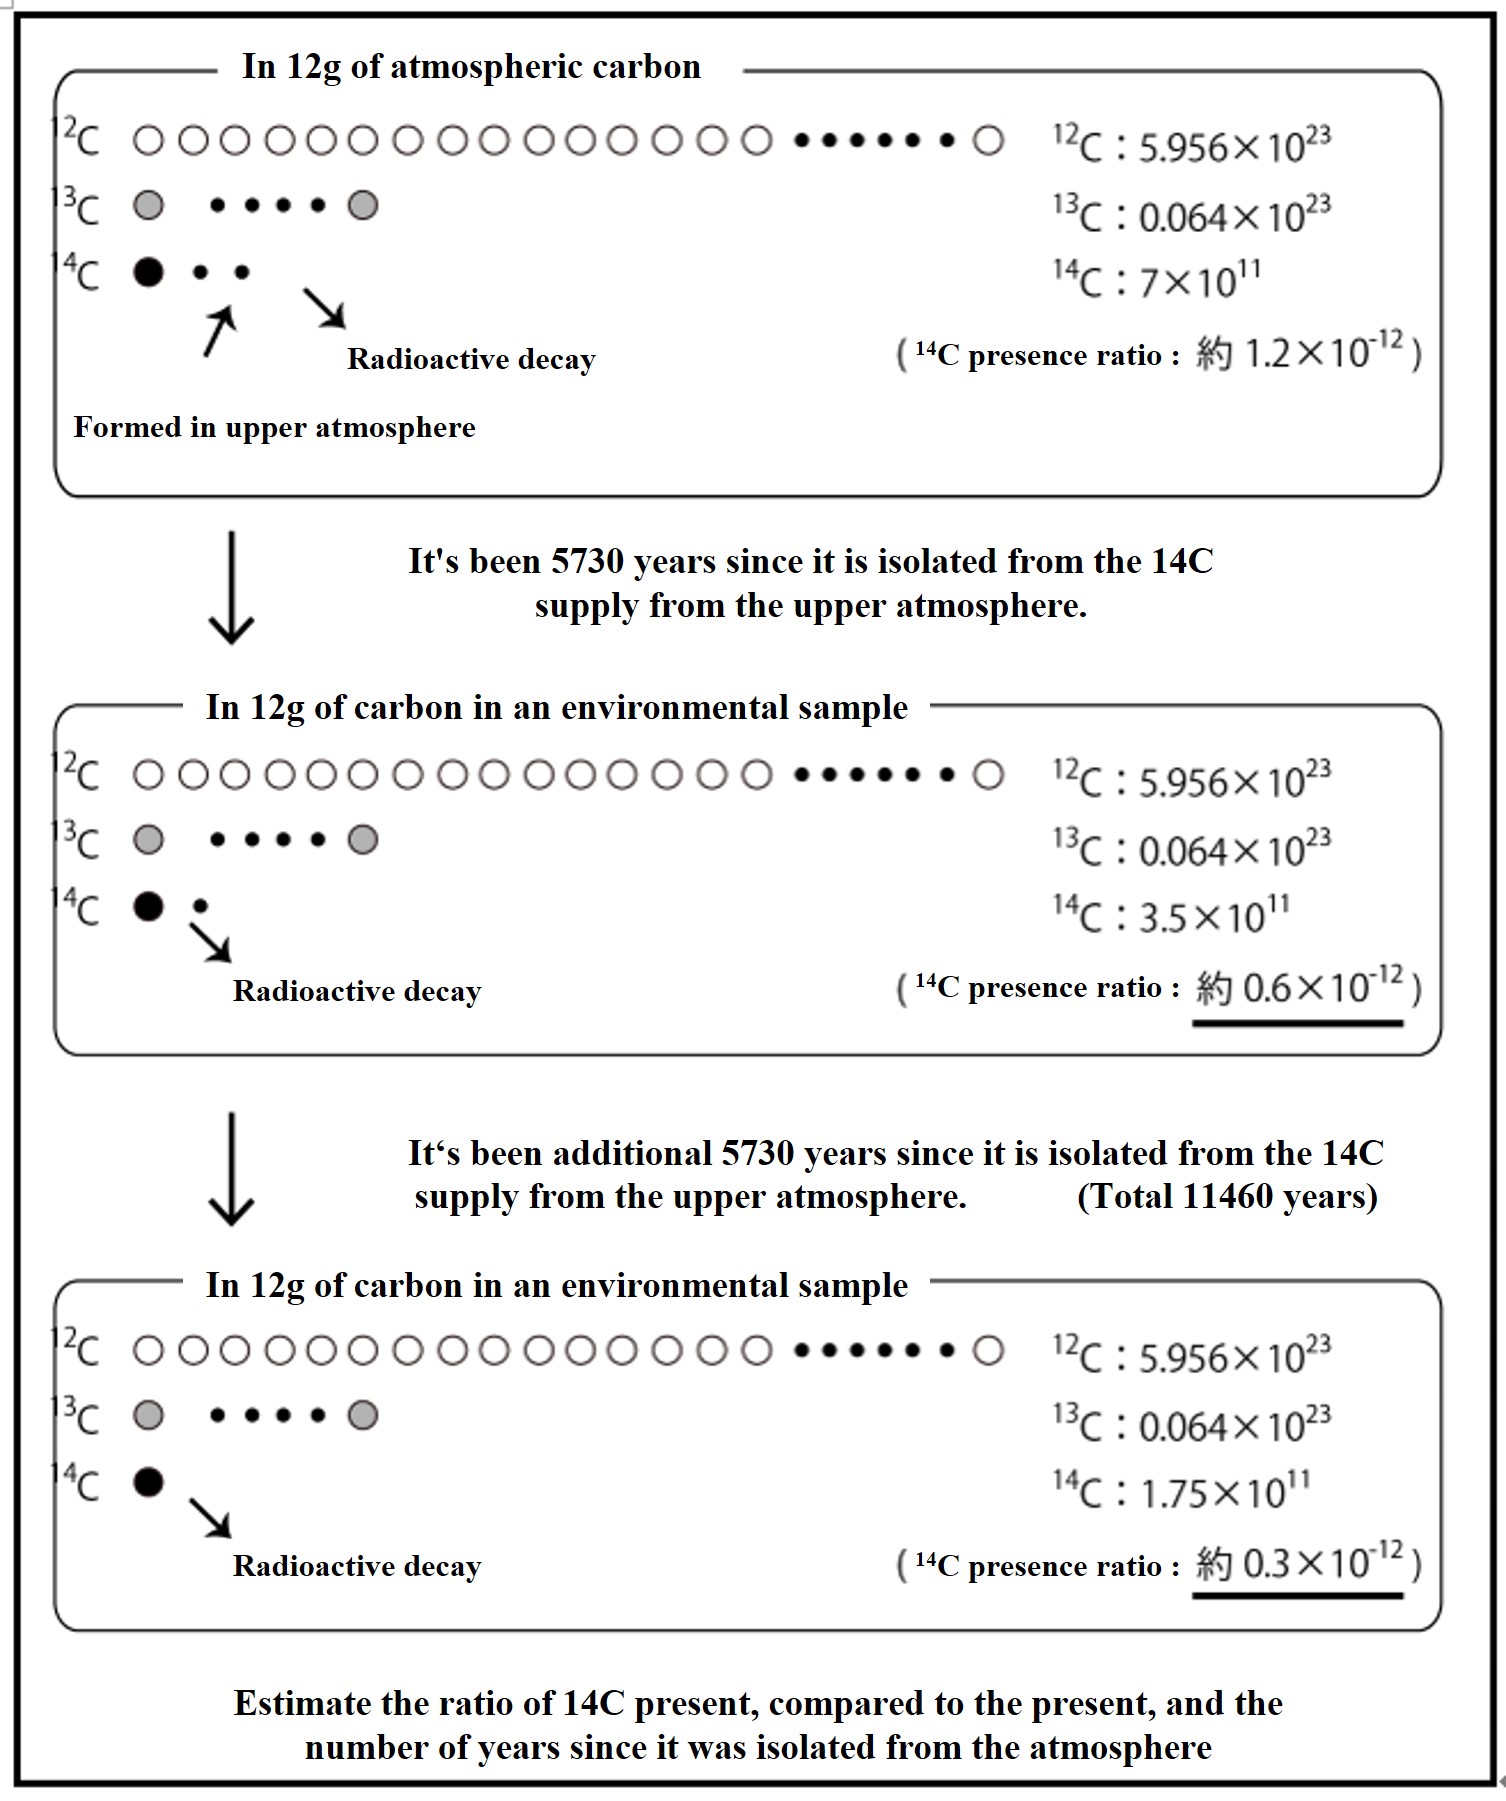
In the upper atmosphere, 14C is formed at a nearly constant rate and β-decays at a fixed rate. 12C is stable, so the 14C / 12C ratio in the atmosphere is constant, with 14C present at a ratio of about 1 in 1 trillion (1.2 x 10⁻¹²). After 5730 years of isolation from the 14C supply from the upper atmosphere, the 14C / 12C ratio is half of its original value (0.6 x 10⁻¹²), and after another 5730 years, the ratio is even half (0.3 x 10⁻¹²). By examining the 14C / 12C ratio in an environmental sample, one can estimate the number of years since it stopped taking up atmospheric CO2 (14C age).
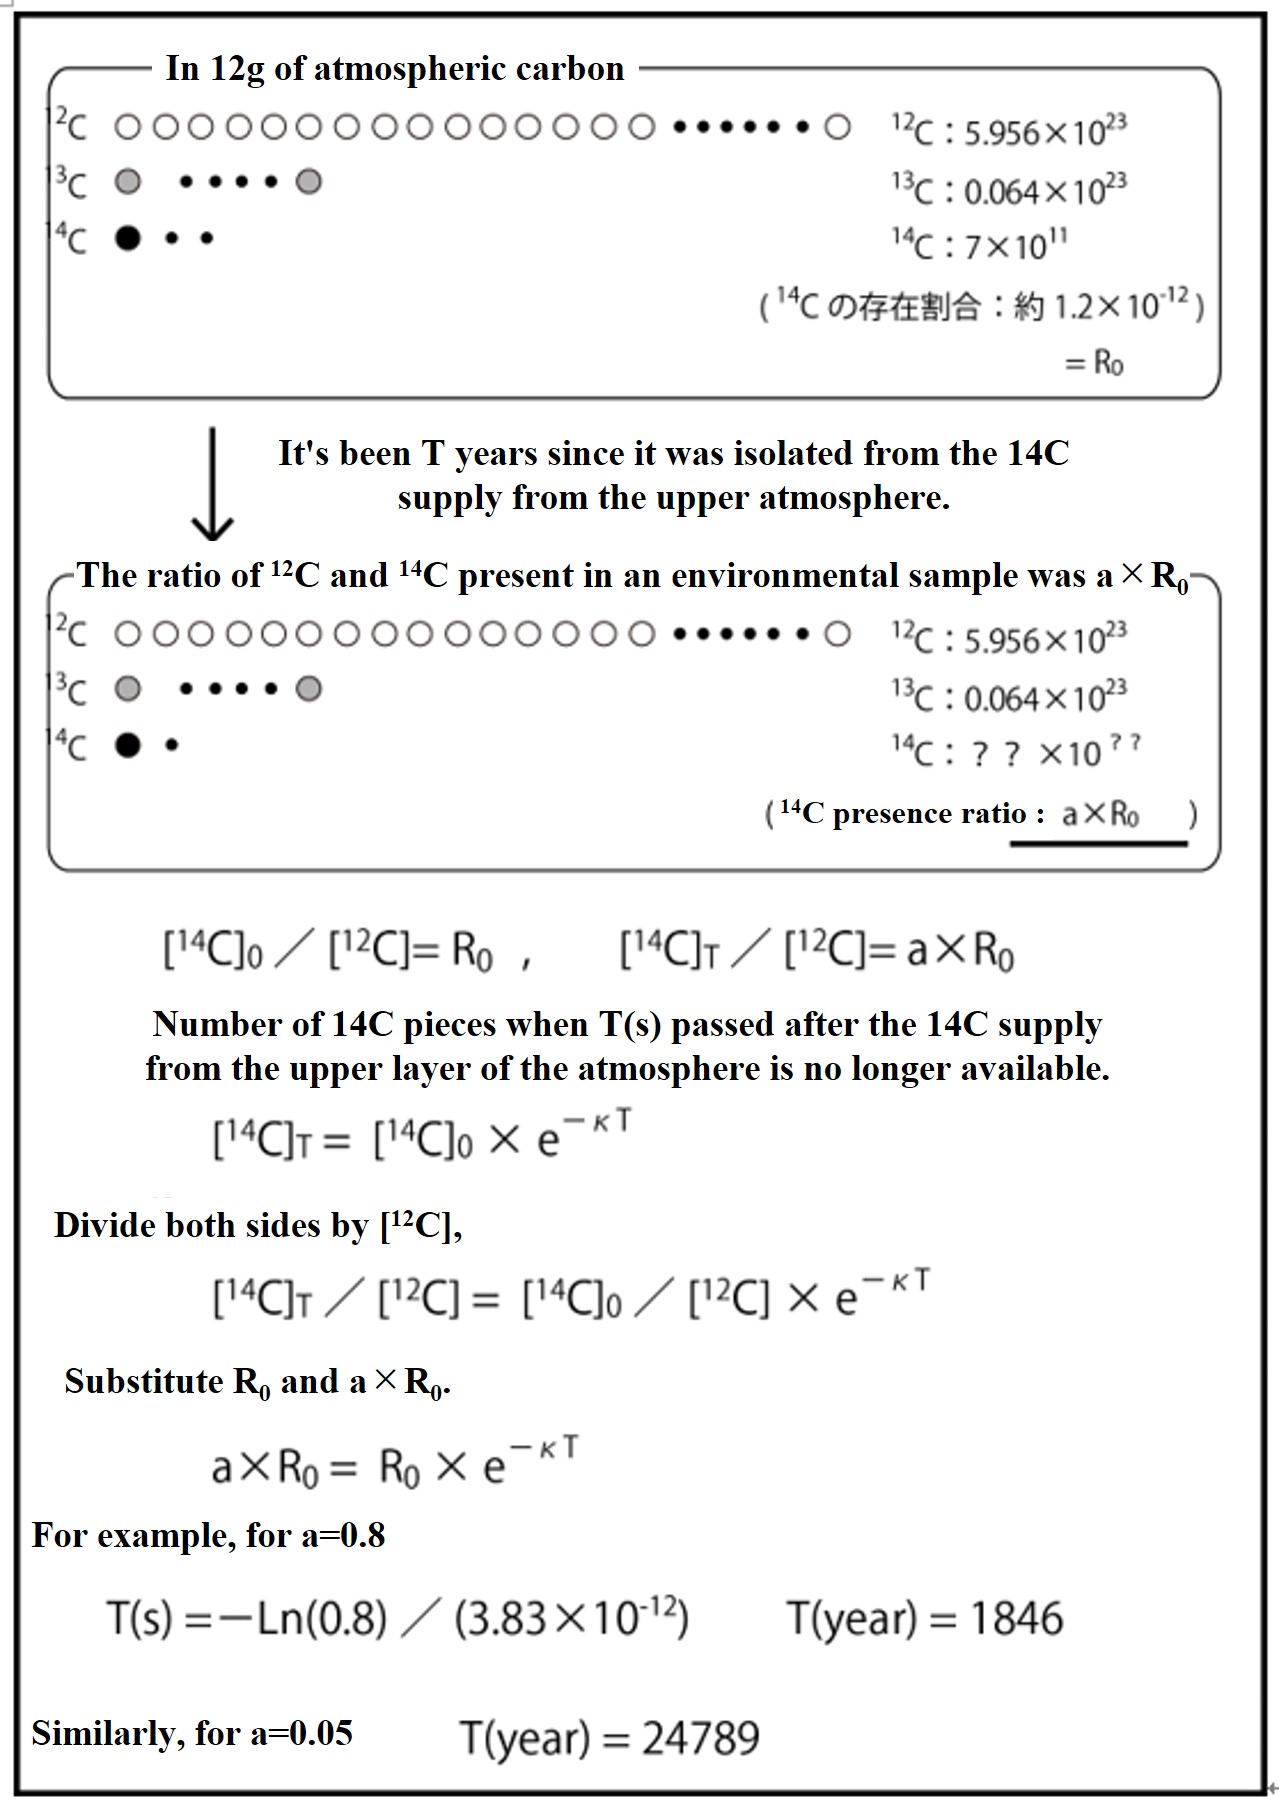
The 14C / 12C ratio of atmospheric CO2 is initially set as R0, and the attenuation coefficient for it is a (<1). If the 14C / 12C ratio (a x R0) in an environmental sample is measured and a is determined, as shown in the figure above, the 14C age (the time since the 14C supply from the atmosphere ceased) can be determined.
If the 14C / 12C ratio (a x R0) in an environmental sample is a = 0.8, it is estimated that 1846 years have passed since CO2 uptake from the atmosphere stopped. Similarly, if a = 0.05, it is estimated that 24789 years have passed.
Currently, the 14C / 12C ratio is measured by an accelerator mass spectrometer. Its measurement limit is about a = 0.005, so the age that can be estimated is up to about 50,000 years ago. In the 1950s, large amounts of 14C were artificially released by nuclear experiments in the atmosphere, which greatly distorts the present 14C / 12C ratio. Therefore, the R0 values used are those of 1950, just before the nuclear experiments were conducted. In addition, plants have slightly different uptake efficiencies for 12C and 14C when they fix CO2 to organic carbon, and slightly different efficiencies for CO2 exchange between the atmosphere and ocean (isotope fractionation effect). The rate of 14C formation in the upper atmosphere is also thought to differ slightly from period to period. The age is estimated by correcting for these isotope fractionation effects and changes in 14C production rates.