Effects of LED light color on behavior
Introduction
In this study, we investigate changes in fish attracting effects of LED light with different light characteristics (color and light intensity) on fish in a natural environment. In addition, experiments were conducted on similar species in an indoor environment where environmental factors can be eliminated. This study aims to investigate the effects of changes in light characteristics on behavior and to identify the light conditions that attract or repel fish, as well as those that increase or decrease fish activity.
Materials and methods
LED lights (white, red, green, blue, and cyan) were directed into the sea through observation windows on the undersea floor of the tower, and video cameras were used to observe fishes on the window surface. Still images were extracted from the recorded
video at regular intervals and binarized, and then the number of individuals was counted. We also used computer image analysis to track the behavior of the fish and measured the distance they traveled and the time they spent in the water.
Results
As an example, a photograph of the observation window under blue LED light exposure and a binarized image for measurement are shown below. The dominant species was white-edged rockfish.

Fig.1 the observation window (blue light) and a binarized image.
Fig. 2 shows an example of observation. This result shows that the number of observed individuals is in the order of blue > cyan > white > green > red. This trend repeats even after multiple observations. The reason for the sharp decrease
in the number of individuals observed immediately after sunrise is that the LED light illuminance is relatively lower than that in the sea.

Fig.2 The number of individuals observed at different times of the day when exposed to LED light of different colors.
The following is an example of an image during image analysis. The blue grid in the image is the measurement range, and the image distortion is corrected accordingly to obtain the coordinates of the trajectory. The orange line shows the trajectory actually tracked. Fig. 4 summarizes the distance traveled and time spent based on this trajectory, excluding the component of periodic motion caused by waves.
Fig. 3 Example of the image during video analysis. Tracking from the appearance of the caudal fin as a target point to its disappearance on the window surface.


Fig.4 Boxplots for distance traveled and time spent by observed individuals based on video analysis
The figure shows that both travel distance and time spent are significantly greater for the blue light. Surprisingly, the results for the white light color were lower than those for the green and red colors. This suggests that the blue color not only attracts more fish, but also increases their activity and is more attached to the light.
These results indicate that light color not only affects fish attracting effects, but also affects their behavior. These features are naturally expected to differ among fish species. Therefore, when considering a specific fishery, new ideas for preventing bycatch using light may emerge with regard to the species we want to catch or release.
The above contents are excerpted and modified from the following research reports.
田内葉子・藤森康澄・清水晋・片倉靖次, 屋外・屋内実験におけるLED光照射時のエゾメバル(Sebastes taczanowskii)の行動, The 2019 autumn meeting of the Japanese Society of Fisheries Science (Fukui Prefectural University), 2019.
Supplement: Improving Efficiency of Analysis
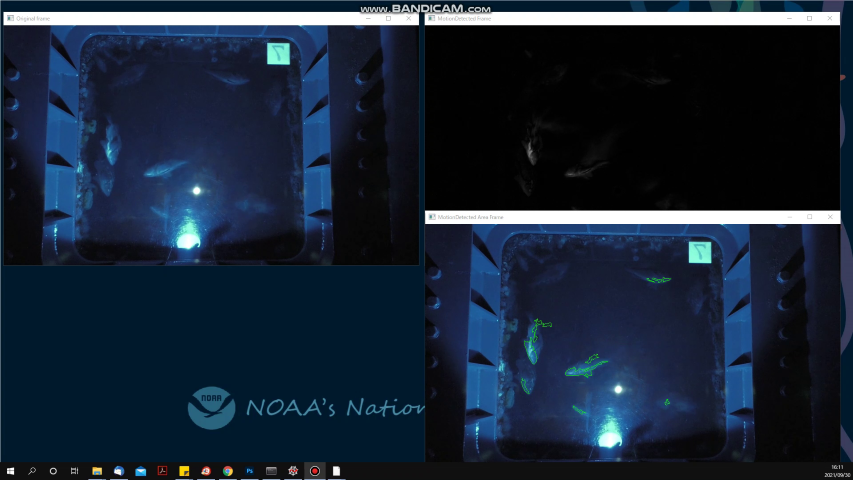
Video analysis requires a great deal of effort and time. Therefore, we are currently conducting research on automatic population counting. The following is an example.

Upper left: original image, upper right: conversion to grayscale, lower right: after conversion, background difference of video is taken and contour extraction is performed.

