
Tritium (Tritium) - Details of cosmic-ray radionuclides -
Section outline
-
-
As indicated by the element symbol, it is an isotope of hydrogen. Also called tritium.Tritium has one proton and two neutrons. Another isotope of hydrogen is deuterium, which has one proton and one neutron and is non-radiative. In addition, general hydrogen is 1H, which is also called light hydrogen. Only tritium emits beta rays and becomes stable helium 3He.
The picture below shows the tritium formation process.
It is attracting attention because it is contained in the treated water from the Fukushima nuclear accident, so I think there is an image that it is artificially generated. However, as shown in this blue box, tritium is mostly produced by nuclear spallation reactions when secondary cosmic rays (neutrons) hit nitrogen and oxygen present in the atmosphere. In addition, when neutrons reach the surface of the earth, they hit lithium and uranium in the earth's crust, and tritium is also generated by natural nuclear reactions.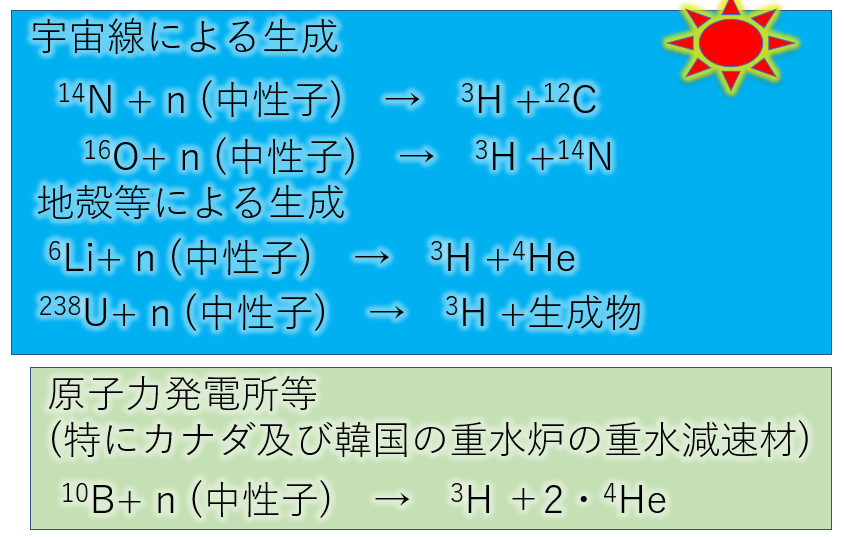 宇宙線による生成 generated by cosmic rays地殻等による生成 Generated in the crust, etc.中性子neutron 生成物product 原子力発電所等Nuclear power plants, etc.特にカナダ及び韓国の重水炉の重水減速材 Heavy water moderator especially for heavy water reactors in Canada and South Korea
In addition, in most cases of nuclear power generation, boron etc. are used to slow down the speed of neutrons used in nuclear fission, and the boron and neutrons undergo a nuclear reaction and tritium is generated (below the picture above).
-
Now, in order to understand the origin ratio of tritium existing on the present earth, we summarized the history of tritium emission (pictured below).The box on the left indicates artificial origin (orange) and natural origin (blue). The gray bar on the right shows the amount of tritium. Abundance is higher at the top of the bar.
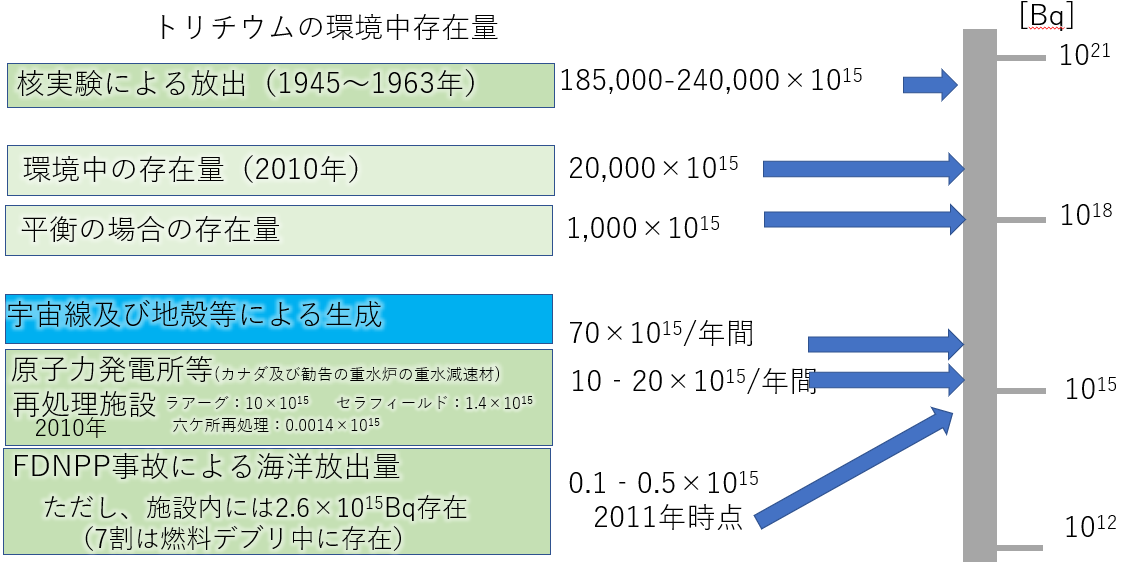
トリチウムの環境中存在量Environmental abundance of tritium 核実験による放出 環境中の存在量Released by nuclear testing Amount in the environment 平衡の場合の存在量Abundance at equilibrium 年Year 宇宙線及び地殻等による生成Generated by cosmic rays, crust, etc. 再処理施設Reprocessing facility ラアーグRaag セラフィールドSellafield 六ヶ所再処理Rokkasho Reprocessing 事故による海洋放出Accidental release into the ocean ただし、施設内には2.6x10^15 Bq 存在(7割は燃料デブリ中に存在)However, 2.6x10^15 Bq exists in the facility (70% exists in fuel debris)
Toshihiko Yamanishi, 2013, ``On the physical properties of tritium'' (Germany) Japan Atomic Energy Agency. For more information on tritium, please see here.
As you can see from the picture above, the largest release of tritium in history was the nuclear test (top left). It is a tremendous amount of about 185,000 to 240,000 PBq (× 10^15 Bq).
The amount present in the environment after nuclear testing (2010) is 20,000 PBq. Prior to the nuclear test (only from natural sources), it was 1,000 PBq (the abundance in the case of equilibrium below that), so the amount of tritium in the environment increased by 20 times due to the release of tritium due to the nuclear test. And it means that the effects of nuclear testing still remain today.
In the picture above, the blue box shows the annual natural tritium production. The annual amount of tritium generated from natural sources is 70 PBq. By the way, the amount released into the environment by the Fukushima Daiichi Nuclear Power Plant accident is said to be 0.1 to 0.5 PBq. Currently, it is said that there is 2.6 PBq in the facilities of the Fukushima nuclear power plant. This means that the amount of tritium produced on earth each year is about 30 times greater than the amount of tritium released in the Fukushima Daiichi Nuclear Power Plant accident.
-
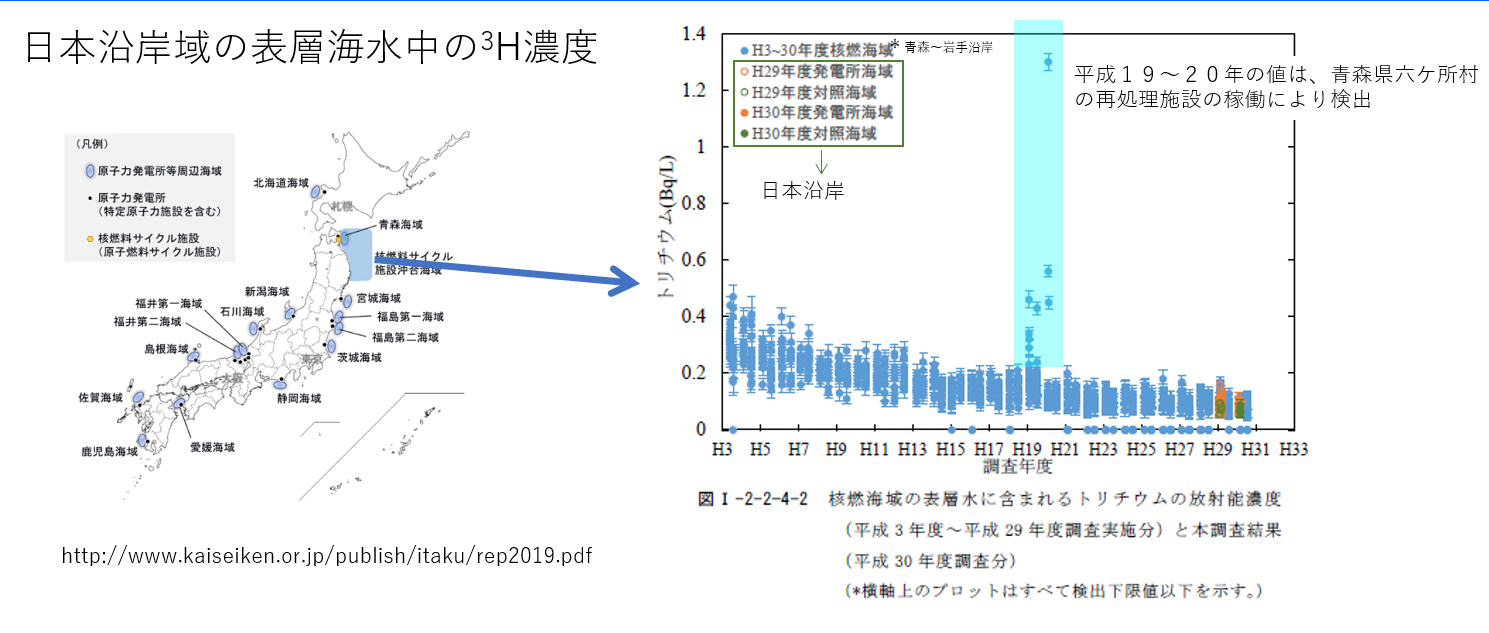
Thorium concentrations in seawater off the coast of Japan
Then, how much tritium is present in coastal seawater in Japan? The figure below (right) shows the transition of tritium concentrations in coastal seawater from Aomori Prefecture to Iwate Prefecture (indicated in dark blue on the map of Japan).
Around 1991, the concentration was 0.2 to 0.4 Bq/L, but due to the half-life of tritium (approximately 12 years) and diffusion from the surface layer to the lower layer, it gradually decreased to 0.1 Bq/L in 2018. Also, the light blue bar is the tritium detected when the reprocessing plant in Rokkasho Mimura started operation. Since then, the reprocessing facility has been temporarily suspended. In addition, the operation was approved in the summer of 2020.
The orange areas for 2017 and 2018 (bottom right) show the tritium levels in seawater around nuclear power plants throughout Japan (from Hokkaido to Kyushu). There is almost no difference by sea area, and it is uniform throughout Japan.
日本沿岸域の表層海水中の3H濃度Concentration of 3H in surface seawater in coastal areas of Japan
北海道Hokkaido 札幌Sapporo 青森Aomori 新潟Niigata 宮城Miyagi 福島Hukushima 第一the First 第二the Second 茨城Ibaraki 石川Ishikawa 静岡Shizuoka 福井Hukui 島根Shimane 愛媛Ehime 佐賀Saga 鹿児島Kagoshima
凡例legend 原子力発電所等周辺海域Sea areas around nuclear power plants, etc. 原子力発電所Nuclear power plant 特定原子力施設を含むIncluding specified nuclear facilities 核燃料サイクル施設nuclear fuel cycle facility 原子燃料サイクル施設Nuclear fuel cycle facility HXX年度1988+XX year 核燃nuclear combustion 発電所Power plant 対照contrast 日本沿岸Japanese coast 沖合offshore平成19~20年の値は、青森県六ケ所村の再処理施設の稼働により検出Values for 2007-2008 were detected from the operation of the reprocessing plant in Rokkasho Village, Aomori Prefecture.核燃海域の表層水に含まれるトリチウムの放射能濃度(平成3年度~平成29年度調査実施分)と本調査結果Radioactivity concentration of tritium contained in the surface water of the nuclear combustion area (from 1991 to 2017 survey) and the results of this survey横軸上のプロットはすべて検出限界以下を示すAll plots on the horizontal axis are below the detection limitLink to the website of the Marine Environmental Research Institute
-