Training of Marine Ecology 2: Eelgrass Bed Communities
章节大纲
-
-
【Diversity Analysis】
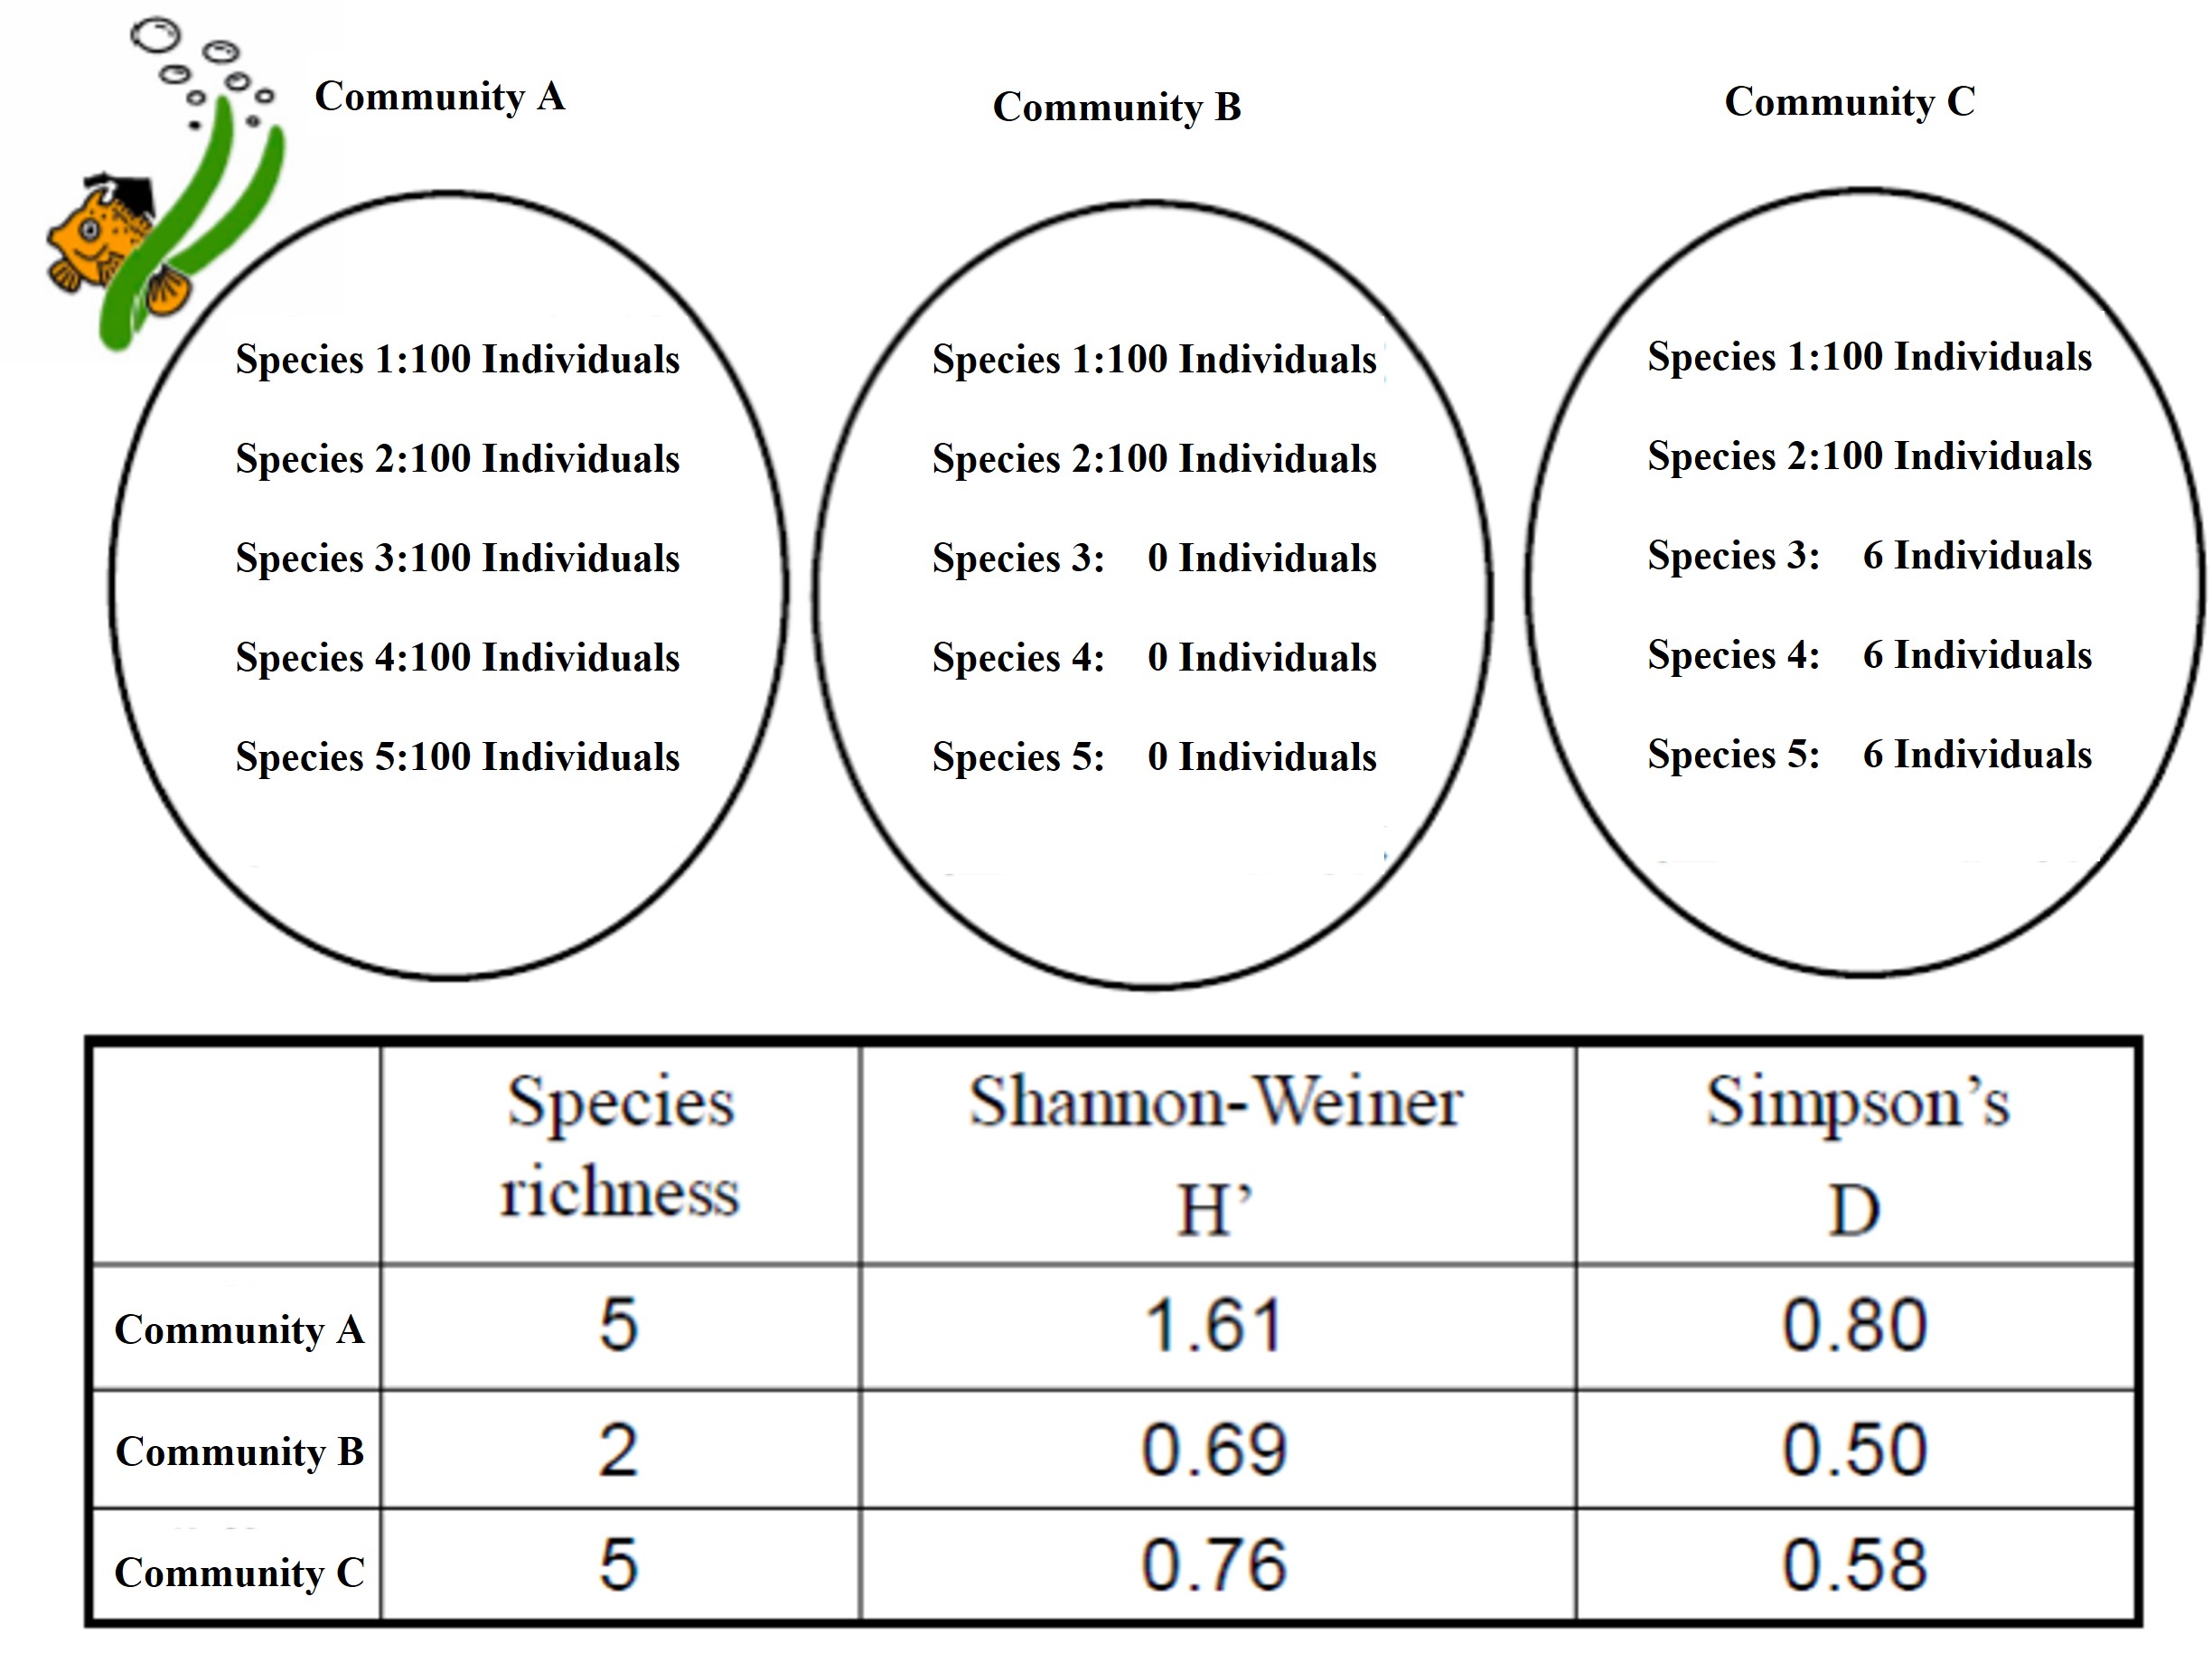
Even if a community has the same number of species, the relative proportion of individuals of each species (evenness) will give a different impression of the community's richness. The diversity index is an indicator of community diversity based on two factors: "species richness" and "evenness of species composition", calculated from the number of species and the number of individuals of each species. Two commonly used indexes are shown below.
Shannon-Weiner Diversity Index
Simpson's Diversity Index

In both cases, S is the number of species and pi is the percentage of the total population that is occupied by species i (relative dominance).
-
A numerical example is shown below. It can be seen that even though the number of species is the same, the diversity index differs due to differences in evenness.
-
【Analysis of community similarity】
The similarity index is a continuous expression of the difference between two communities, with 100% for the case where the species composition and the number of individuals of each species occurring in the two communities are exactly the same and 0% for the case where they are completely different (not a single common species). Although many different methods have been developed, we will use the Bray-Curtis similarity index shown in the equation below.
Sjk: The similarity between the jth sample and the kth sample
Yij: Number of individuals of the ith species in the jth sample (present and coverage)
The similarity index is a value obtained between pairs of every two communities, so for a data set consisting of n samples, a similarity of n(n-1)/2 is obtained. The representation of this in the form of a match table is called a similarity matrix.
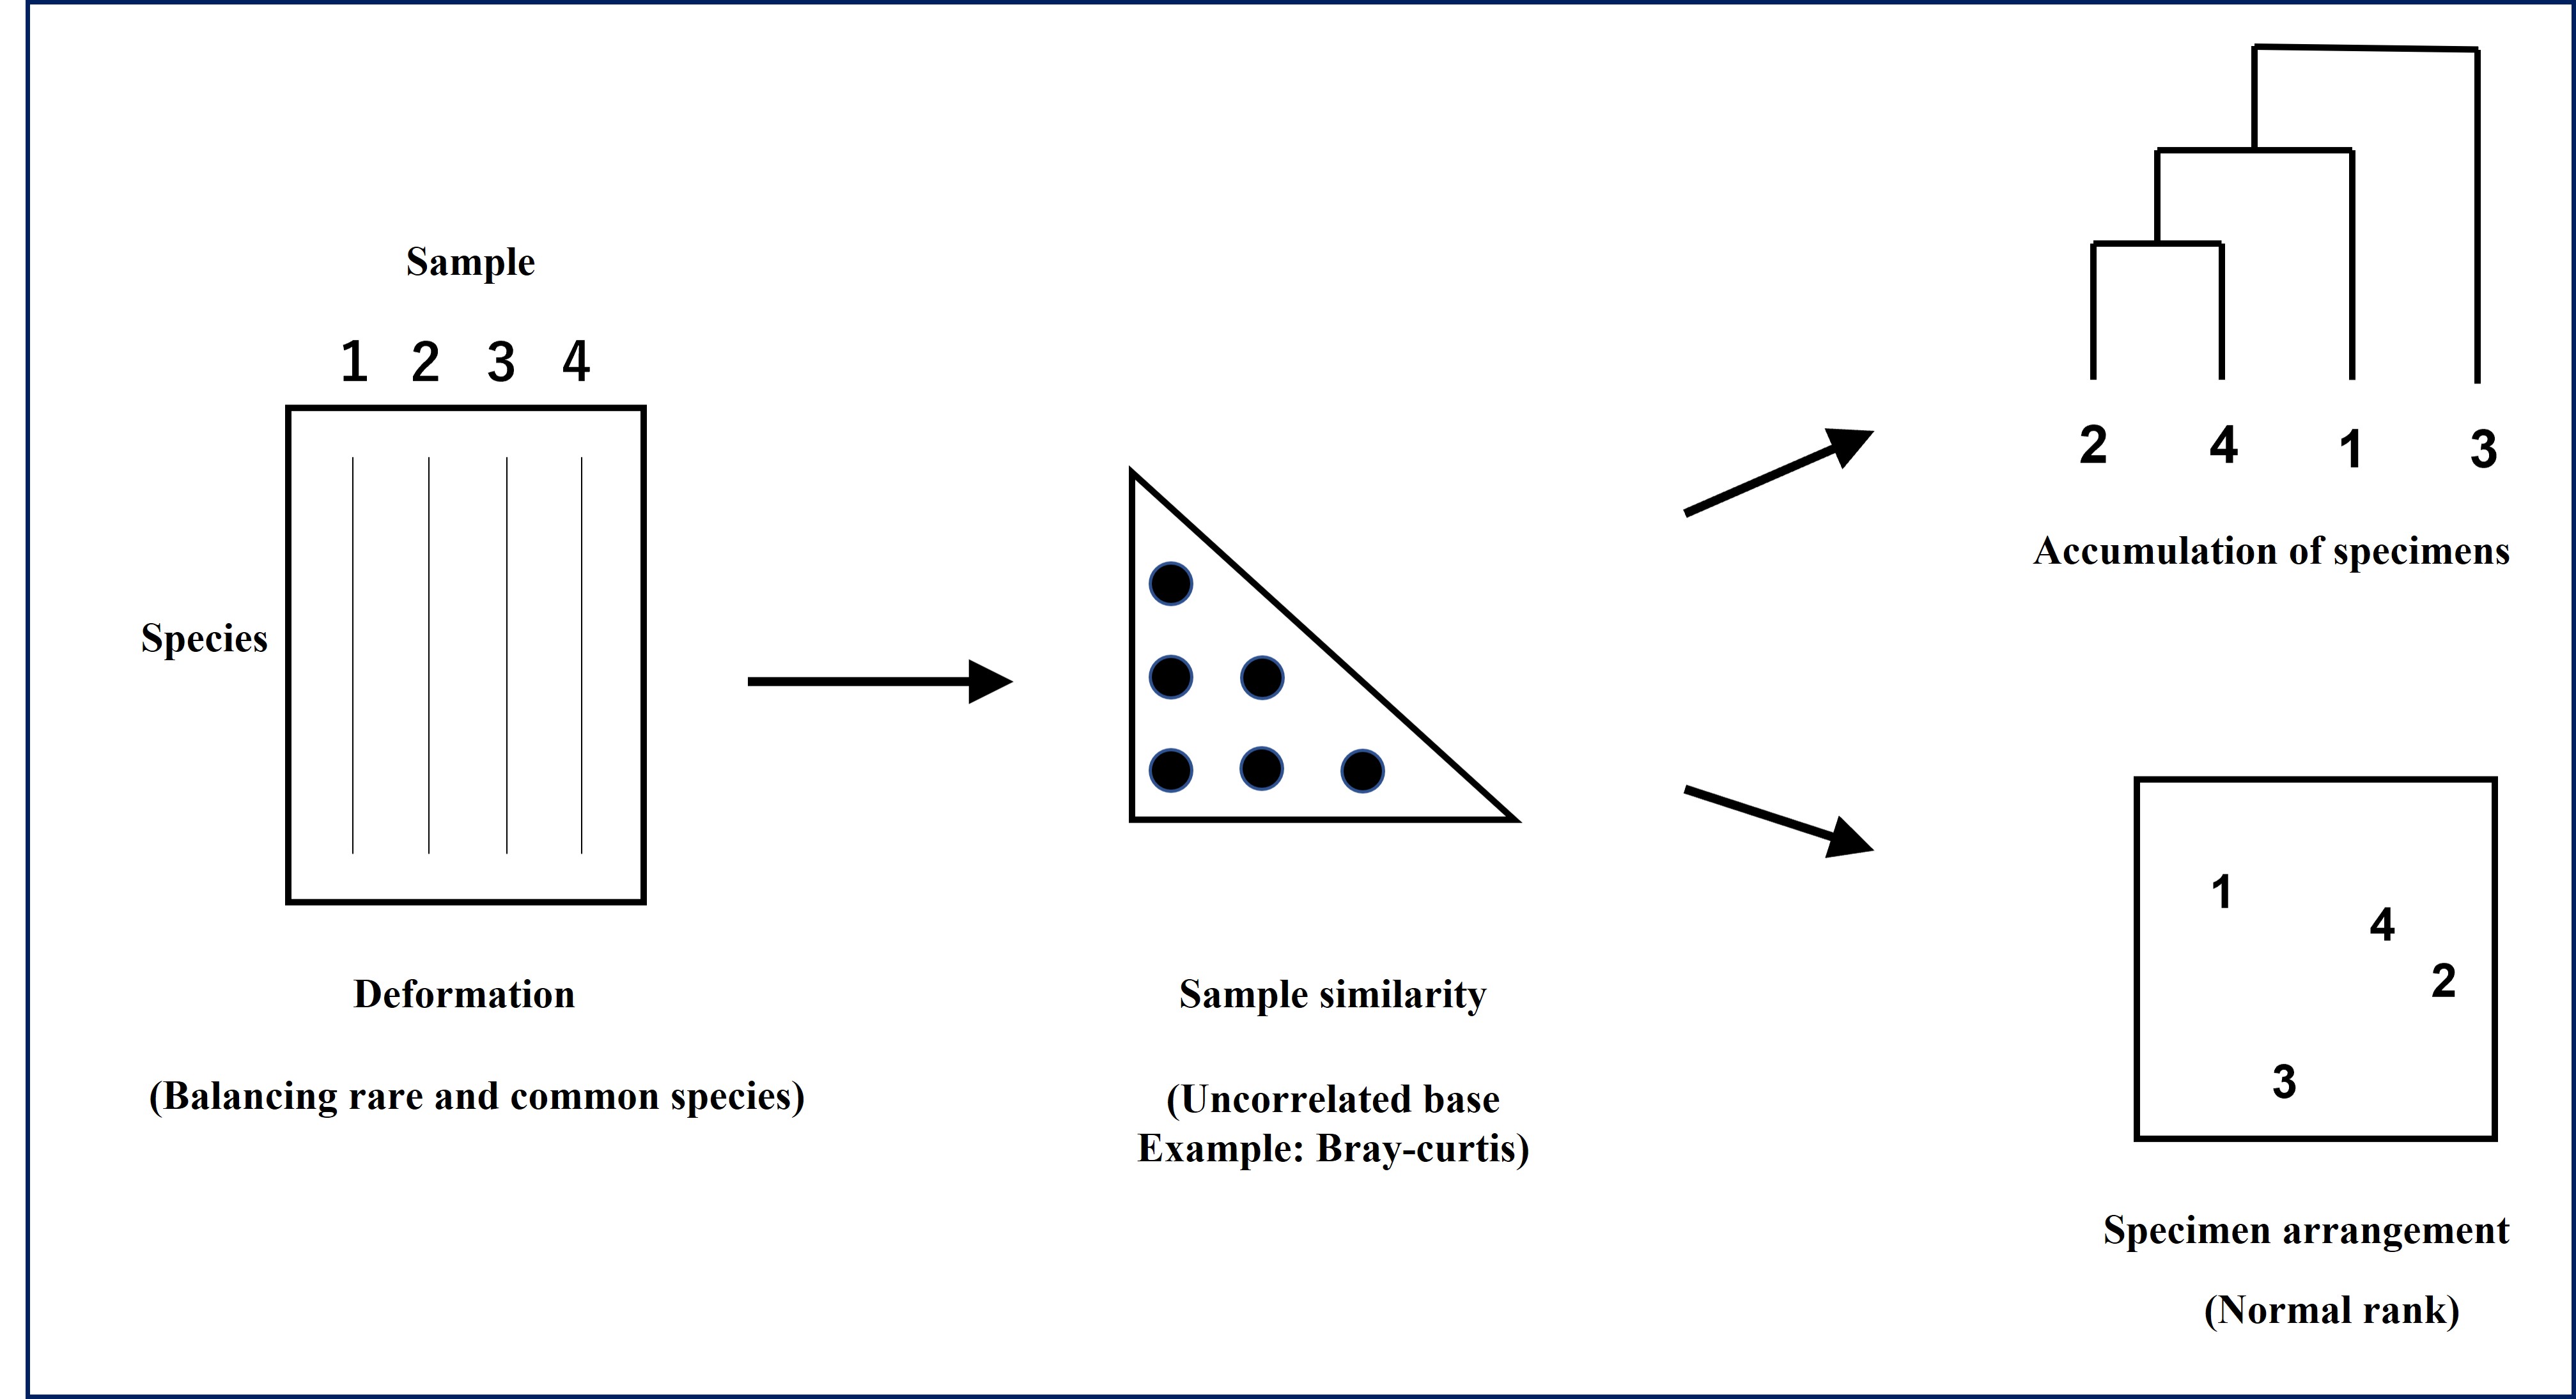
Many methods have been developed to visually represent similarity relationships between communities based on similarity matrices. There are two main types of methods: 1) clustering (cluster analysis), which classifies (divides) clusters according to the magnitude of similarity, and 2) ordination, which plots the differences in similarity between clusters in a 2-dimensional (3-dimensional) space as the difference in distance. Although knowledge of multivariate statistical analysis is necessary to understand the characteristics, advantages, and disadvantages of each method, here we will classify communities by cluster analysis, which is relatively simple. Cluster analysis arranges the locations of communities so that more similar communities are located closer together. There are many ways to do this, but in this article, we will introduce the linkage method using group-average linkage, which can be done by hand calculation. -
-
-
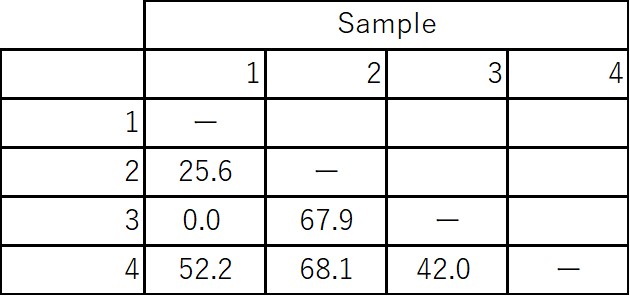
1:In the original 4x4 similarity matrix, sample 2 and 4 have the highest similarity [S(2,4)=68.1%], so we first concatenate these two
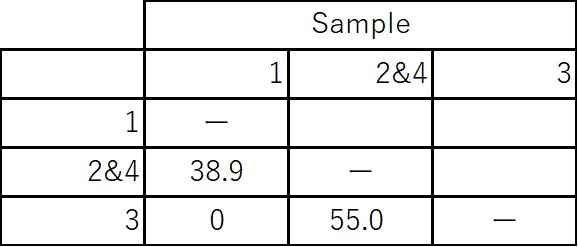
2:Create a 3x3 similarity matrix combining data from 2 and 4 S(1,2&4)=[S(1,2)+S(1,4)]/2=38.9%, S(3,2&4)=[S(3,2)+S(3,4)]/2=55.0%
3:Since S(3,2&4) is maximum in the 3x3 group matrix, we then concatenate these two
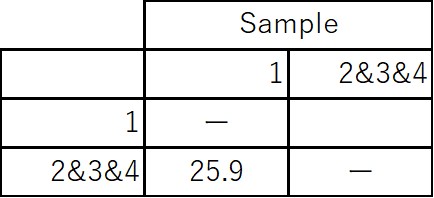
4:Finally, concatenate 1 and 2&3&4 S(1,2&3&4)=[S(1,2) + S(1,3) + S(1,4)]/3=25.9%
Data Tables for Community Structure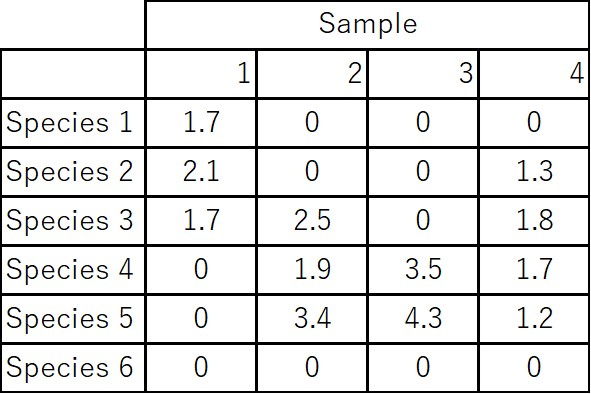
Similarity matrix (before concatenation)
Similarity matrix (after concatenating 2&4)
Similarity matrix (after concatenating 2&3&4)

-
-