섹션 개요

    •  Phytoplankton is the starting point of the material cycle (food chain (web)) in the marine ecosystem. Therefore, investigating factors that control phytoplankton distribution and photosynthesis are very important for further understanding of marine ecosystems and for predicting climate change including global warming. Light and nutrients (nitrogen, phosphorus, silicon) are essential elements in the photosynthesis of phytoplankton. In particular, the light that enters the water is absorbed by various substances such as water molecules, suspended solids, and colored dissolved organic matter, so it is attenuated as the water depth increases. Therefore, the light environment in water is darker than that on land.

       Phytoplankton have various pigments such as chlorophylls, carotenoids, and phycobilins to efficiently absorb light and protect themselves from strong light. Different phytoplankton species have different pigments, but all phytoplankton (with one exception) always have a pigment called "chlorophyll a". Therefore, this pigment is measured all over the world as an indicator of phytoplankton biomass.

       In this marine ecology practice, you will learn basic ocean observation techniques, water sampling methods, and chlorophyll a concentration measurement using a fluorometer. In addition, microscopic observation is easily performed.  Each group observes at different points, then measures, and later compares the data of each group, aiming to consider and deepen our understanding of the relationship between the marine environment and the phytoplankton that live there.

    • ・Things to prepare (prepared by training staff)

      Observation field book and clipboard, pencil, transparency plate, CTD sensor, bucket with string, water sampling bottle for chlorophyll measurement, plankton net (20 µm mesh), water sampling bottle for plankton net

    • ・Work procedures on board

      1. When the ship stops at the survey point, record the following items in the observation field book.

      ◎ Date and time, arrival time, name of observation point
      ◎ Latitude and longitude (confirmed by ship's GPS)
      ◎ Water depth (confirmed with the ship's fish finder)

      2. Transparency measurement using a transparency plate (Secchi disk)

      Video of transparency depth measurement using a transparency plate


      After measuring the transparency, record it in the field notebook.

    • 3. Measurement of vertical distribution of water temperature, salinity and chlorophyll fluorescence by CTD sensor

      Deepen your understanding of ocean stratification and mixing (principle video)


      Measurement of sea water temperature and salinity vertical profile using CTD (video)


    • 4. Sampling surface water using a surface sampling bucket

      After washing the water sampling bottle three times, fill it with water. After sampling, put the bottle in the cooler box.


      5. Sampling near bottom or subsurface chlorophyll maximum (SCM) using Niskin X water sampler

      After washing the water sampling bottle three times, fill it with water. After sampling, put the bottle in the cooler box.

    • 6. Collection of phytoplankton using a plankton net

      After sampling, put the bottle in the cooler box.

    • Seawater collected on board is brought back to the laboratory for analysis. In this study, quantification will be performed using a quantification method using a Turner fluorometer (Model 10-AU, Turner designs) (Welschmeyer, 1994). Dimethylformamide (DMF), an organic solvent, is used to extract pigment from phytoplankton (Suzuki and Ishimaru, 1990).

      Principle of chlorophyll fluorescence (movie)

    • what to prepare

       Seawater sampled by ship, graduated cylinder, filter, suction pump, vacuum gauge, glass fiber filter (GF/F, ca. 0.7 µm, diameter 25 mm), tweezers, Sarstedt tube, glass tube (10 ml), Label stickers, DMF, Turner fluorometer, lab gloves


    • Filtration procedure

      1. Using tweezers, set the filter (glass fiber) in the strainer.
      2. Pour all the seawater in the water sampling bottle into each filter, and filter the seawater under reduced pressure (0.013 MPa or less).
      3. After filtration, immediately pour filtered seawater over the rim of the filter to filter out any particles remaining on the walls.
      4. After filtering, fold the filter with tweezers and lightly pinch it with filter paper to remove moisture.
      5. Place the filter in a Sarstedt tube containing 6 ml of DMF and mix gently (Note: DMF is harmful, so be sure to wear gloves to avoid contact with the skin. If it gets on your hands, wash it off immediately).

      Measurement procedure

      1. Turn on the Turner fluorometer (the spectrometer must be turned on 30 minutes to 1 hour before sample measurement in order to stabilize the lamp light source. It is a good idea to turn on the power before the above filtration procedure).
      2. Measure the high and low fluorescence values ​​of the secondary solid standard with a Turner fluorometer to check the condition of the equipment (this is done only for the first group). If there is no problem, proceed to the next step.
      3. Transfer the solution in the Sarstedt tube to a glass tube.
      4. As a blank, DMF alone is placed in a glass tube, and the glass tube is placed in a Turner fluorometer to read the fluorescence value (BLANK) (also for the first group only).
      5. Place the glass tube in the Turner fluorometer and read the fluorescence value at that time (F).

    • Method of calculation
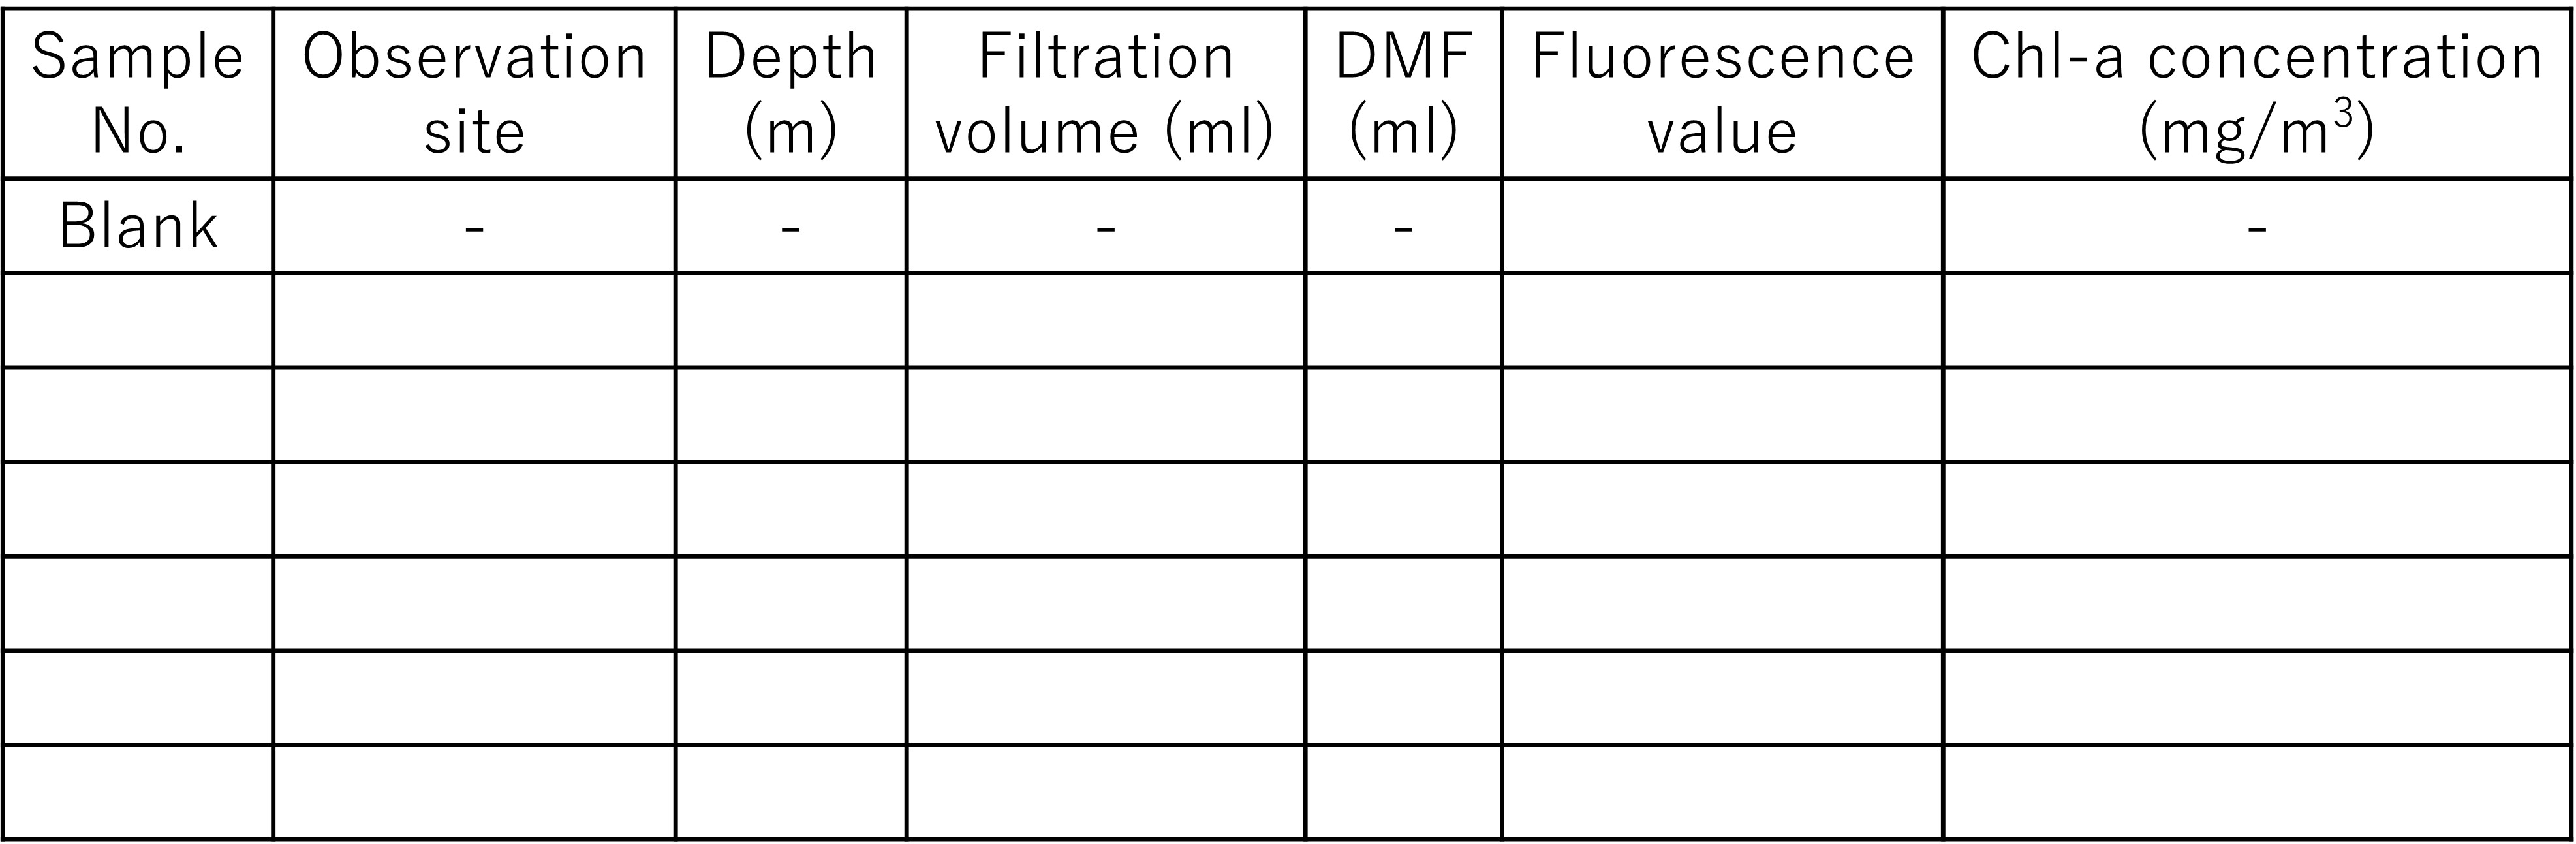
      chlorophyll a concentration (mg/m3)

      Chlorophyll a (mg/m3) = 0.164 × (F – BLANK) × v ÷ V                                                   (1)

        0.164: Slope between known chlorophyll a concentration and current fluorescence value(It is obtained by making several dilution series. Note that this value is slightly different for each device. Here, the calibration value performed in March 2020 is used.)

        v: Amount of organic solvent used for chlorophyll-a extraction (6 ml)
        V:
      amount of filtered water (138.5 ml)

      Figure 1

  • Observe under a microscope what kind of phytoplankton appears in the speculum samples collected by your group (about 1 hour).  Identify as many phytoplankton as possible in the sample. Using a plankton encyclopedia, etc., identify the species name if the species name is known, and Those that can only be identified up to higher taxa are identified up to that level. Record the results on the blackboard for each collection point.

    Based on the data, let's calculate the similarity of each observation point by calculating the Jaccard coefficient shown below, and then perform cluster analysis based on the similarity to create a dendrogram.


    •                                                                                                                  (2)

    • Write your data on the board so that you can compare the environmental factors and phytoplankton abundance at different sites.

      1. longitude, latitude
      2. water depth
      3. transparency (m)
      4. water temperature
      5. salinity
      6. chlorophyll a concentration

       In the report, first try to organize the information written on the blackboard into maps, tables, diagrams, etc. like a thesis.When deciding what to include in a chart or table, consider how best to convey the information to the reader, along with the text of the report. It would be good to investigate the correlation of the obtained data and show it in the results or consider it. Ultimately, based on the results of the cluster analysis, we comprehensively grasped the physical data such as water temperature and salinity, and deliberated on what we could think of. Let's look at.


  •