【What to do when signal intensity beyond the range of the standard sample is obtained from an unknown sample (1)】
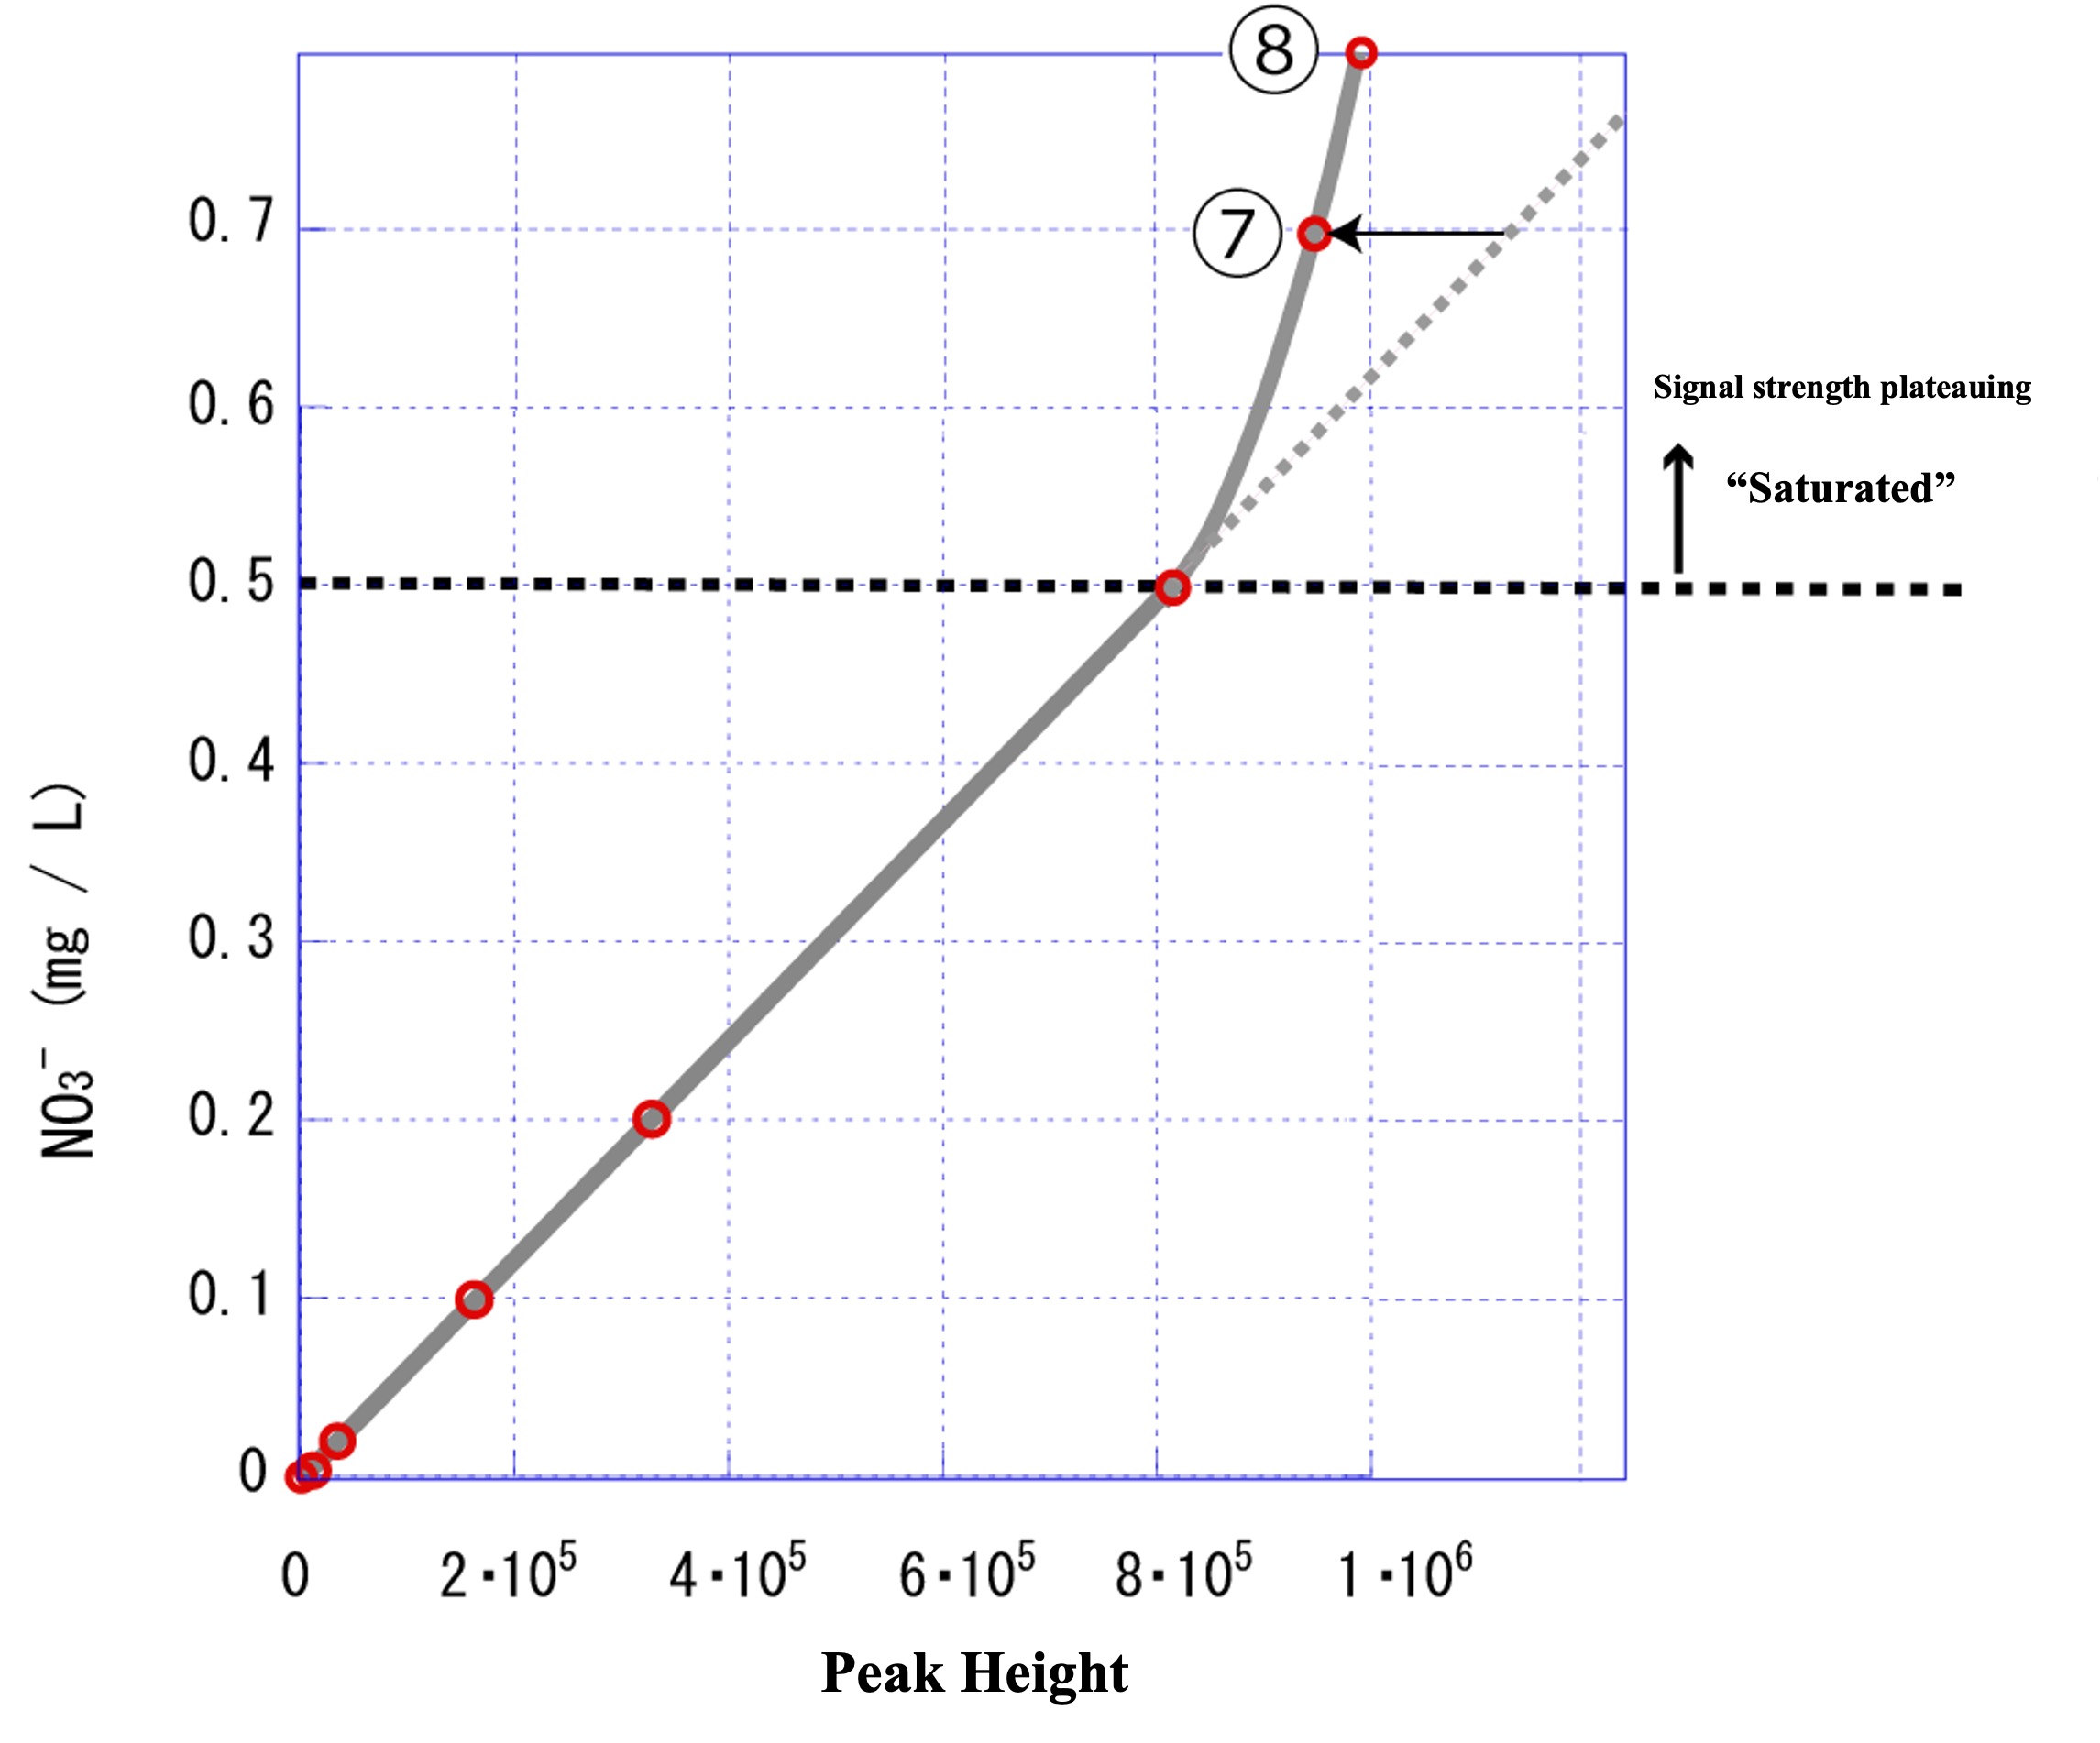
① To ensure that the peak heights of the unknown samples fall within the range of the peak heights of the standard samples, we prepared standard samples ⑦ and ⑧ with even higher concentrations in an attempt to expand the concentration range covered by the calibration curve (straight line).
The results of standard sample ⑦: 0.7 (mg L-1) and ⑧: 0.8 (mg L-1) were added to ⑦ and ⑧ in the figure below.

We expected that measuring the high concentration standard samples ⑦ and ⑧ would result in a plot on the extension of the previous calibration curve (gray dashed line), but as shown by the solid gray line in the above figure, the peak height was smaller than expected. This means that the peak height does not increase in proportion to the NO3- concentration in the range above 0.5 (mg L-1), no matter how much the concentration increases. In other words, it means that the signal intensity has reached a plateau.
【Reasons why the signal intensity in ion chromatography reaches a plateau.】
In ion chromatography, there is an upper limit to the amount of ions that a column can hold, and the upper limit of quantitation is reached when the column saturates with ions. In such cases, it is necessary to dilute the analyzed sample so that the concentration does not exceed the upper limit that the column can retain. Unknown sample (B): The signal intensity (peak height) was 9.3・105, so the regression curve (solid gray line) in the figure indicates that the concentration is in the range of approximately 0.6 to 0.7 mg/L. If this unknown sample (B) is diluted twice, the concentration of the diluted solution will be approximately 0.3 to 0.35 mg/L, which falls within the range of the calibration curve (straight line). Thus, the experiment should proceed successfully by guessing the optimal dilution rate.