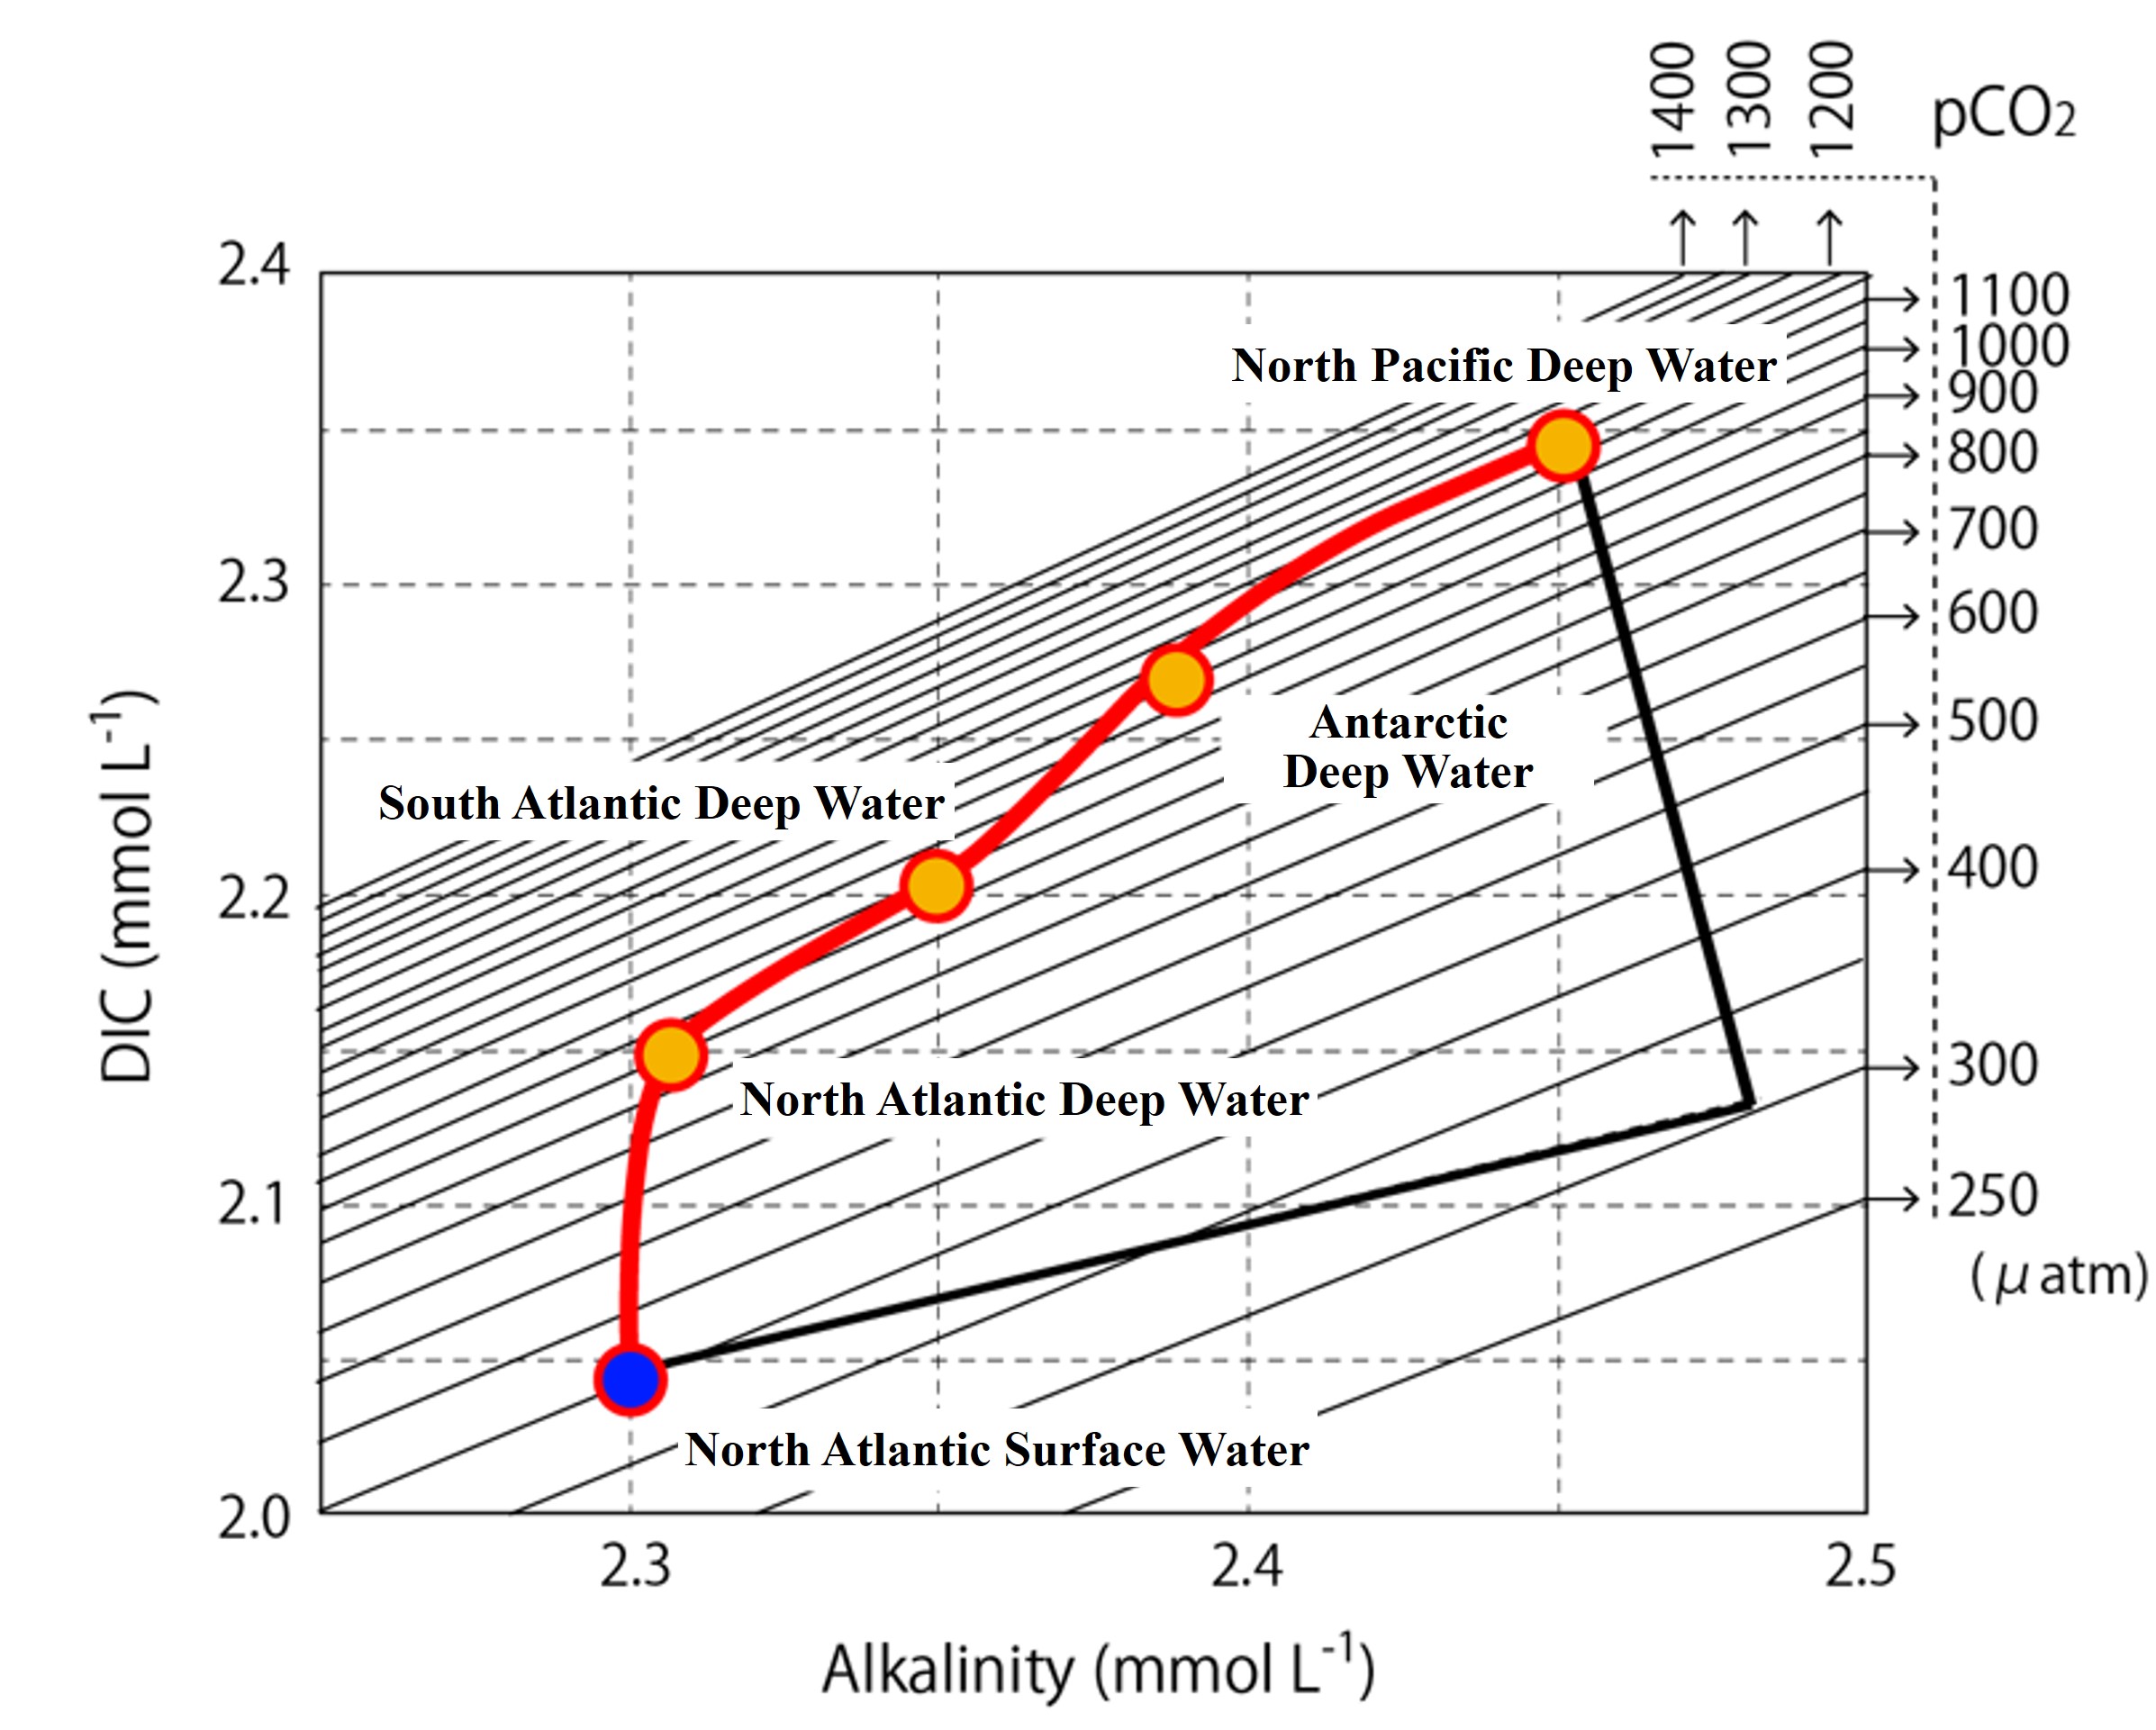
XY Plot of Total Carbonic Acid vs. Alkalinity
單元大綱
-
-
In this section, we consider the distribution of DIC and alkalinity and how they are determined in all oceans.
Solving a total of six equations for the carbonic acid components (three equations), the equilibrium conditions of water, and the defining equations for DIC and Alk, we can find the other two if two of the four items, DIC, Alk, pCO2, and pH, are given. If we try to solve the equation by including boric acid ions, we will end up with a numerical solution of a fifth-order equation, so we simplified the equation to Alk = 【HCO3-】 + 2【CO32-】, and the relationship between DIC, Alk, and pCO2 is shown in the figure below under a water temperature of 20°C and a constant salinity of 34.
-
Actual ocean data is included in the XY plot showing the relationship between DIC, Alk, and pCO2. DIC and Alk in the North Atlantic High Latitudes are marked with blue circles. You can see how Alk and DIC increase as this water sinks into the deeper layers and flows into the deep South Atlantic, deep Antarctic, and deep North Pacific. Noteworthy, from the North Atlantic to the Deep South Atlantic, the increase in Alk is small. Why is this?

-

