
ion chromatography
セクションアウトライン
-
-
An example of the use of ion chromatography (measuring ion components in precipitation) is shown below. Raindrops that fall from the sky contain various ionic components dissolved in them. Natural sources include sulfate ions (sources from volcanoes and marine plants), calcium ions (sources from calcium carbonate minerals), and sodium and chloride ions (sources from sea salts). Human pollutants include sulfuric acid (derived from coal combustion) and nitric acid (derived from automobile exhaust gas). In order to understand atmospheric pollution and weather phenomena, it is necessary to investigate the ionic components in raindrops. Collect rainwater, filter it, and then introduce the sample water into the ion chromatograph.
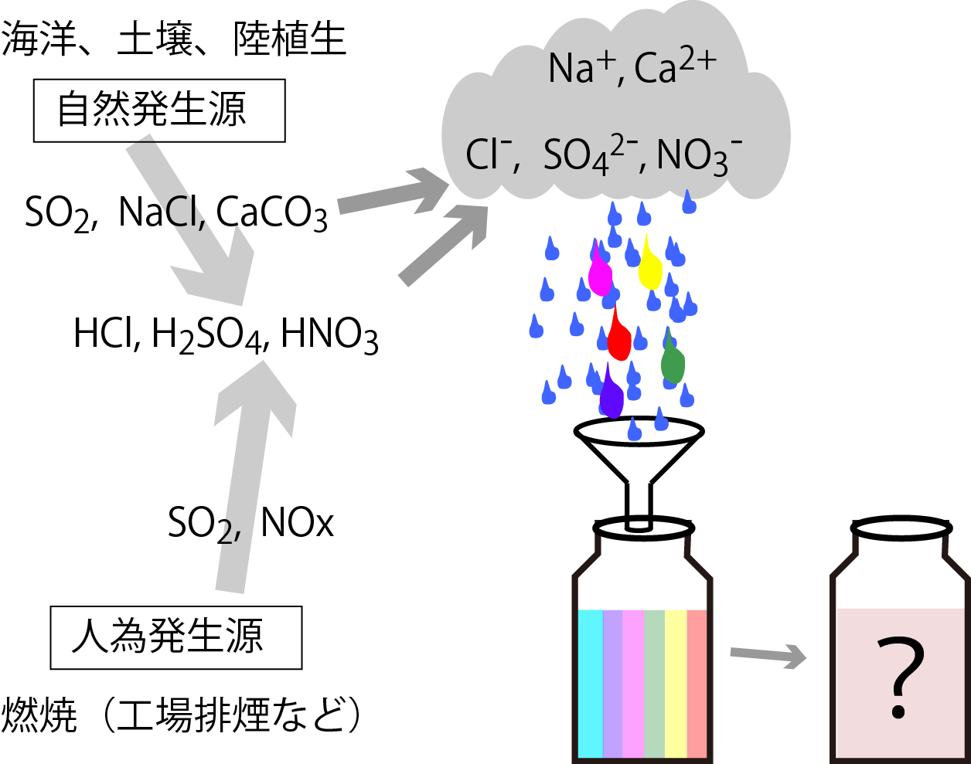
海洋、土壌、陸植生ocean, soil, terrestrial vegetation 自然発生源natural sources 人為発生源anthropogenic source 燃焼combustion 工場排煙などFactory smoke, etc.
The picture below shows the flow of liquid when anions are analyzed using an ion chromatograph.
① A weakly alkaline eluent is always passed through the anion separation column of an ion chromatograph. This is to cover the surface of the ion exchange resin with hydroxide ions before the sample water is introduced.
② Introduce sample water from upstream of the column. The area colored blue in the picture below is the sample water. Sample water does not contain much hydroxide ion (OH-), but contains chloride ion (Cl-) and nitrate ion (NO3-). These are separated on a downstream ion exchange resin column.
③ When water containing chloride ions (Cl-) and nitrate ions (NO3-) enters the column, the chloride ions (Cl-), which are weakly adsorbed by the resin, flow first, while the nitrate ions (NO3-), which are strongly adsorbed, flow later.
④ The water component of the sample water comes out before the ionic components contained in the sample water. This is because it passes through the ion exchange resin without being adsorbed.
⑤ After the water component of the sample water flows out, the eluent (weakly alkaline) flows again. Chloride ions (Cl-) and nitrate ions (NO3-) contained in the sample water are separated in that order and flow out with the eluent.
⑥ After the ionic components of the sample water flow out, the ion exchange resin is once again covered with hydroxide ions (OH-), making it ready for the next analysis.
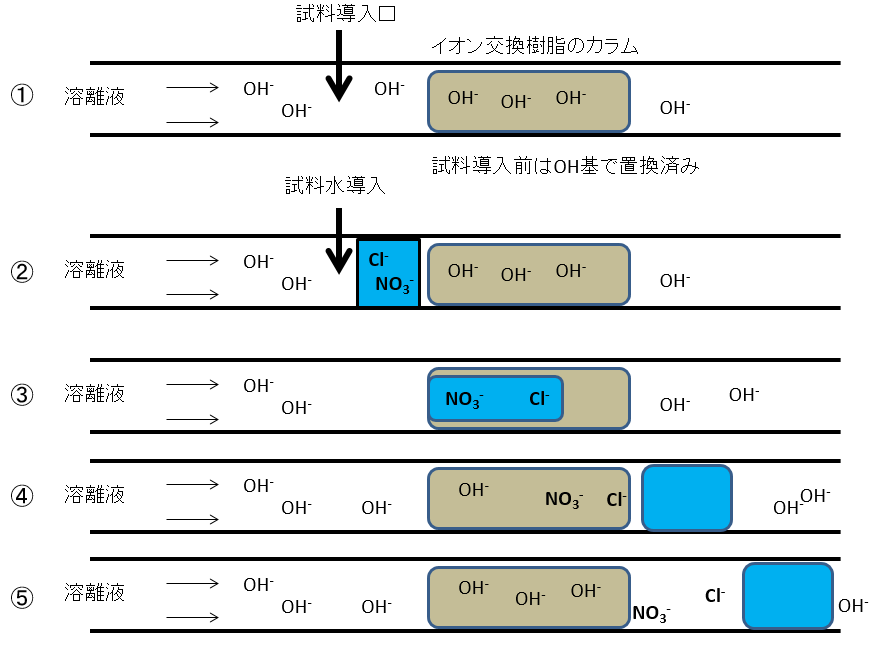
試料導入口Sample inlet イオン交換樹脂のカラムion exchange resin column 溶離液Eluent 試料導入前はOH基で置換済みSubstituted with OH group before sample introduction
-
Place the detector downstream of this anion exchange column. An electrical conductivity meter is placed here (red arrow in the picture below).
⑥ Electrical conductivity is constantly monitored, even when weakly alkaline eluents are flowing. The electrical conductivity with only the eluent was 10. This will be the baseline for your chromatogram.
⑦ When sample water is introduced, the water component of the sample water flows out first. This is closer to fresh water than the eluent, so its electrical conductivity decreases. It is detected as a negative peak relative to the baseline. This is called the "solvent peak."
⑧ After the solvent peak, the electrical conductivity returns to the baseline of the eluent, but then the ionic components in the sample water are separated and released. Chloride ion (Cl-), which has a small adsorption capacity, came out. Since Cl- is added to the eluent, the electrical conductivity increases. It is detected as a positive peak in the chromatogram.
⑨ After chloride ion (Cl-), the sample returns to the eluent base and then the nitrate ion (NO3-) peak is detected.
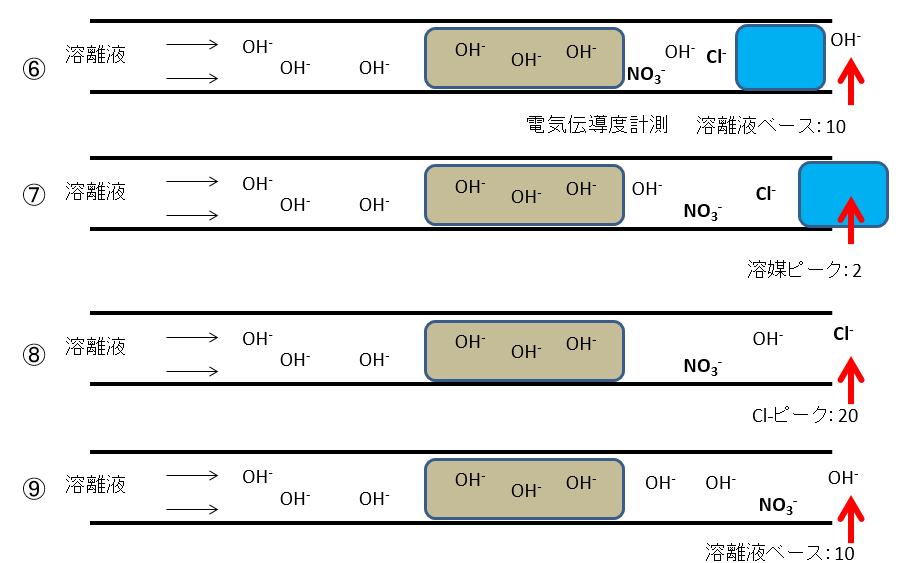
電気伝導度electrical conductivity 溶離液ベースeluent based ピークpeak 溶媒solvent
-
After the last ionic components have flowed out, the eluent returns to its baseline.
(In the picture below, nitrate ions are drawn last, but in reality, sulfate and phosphate ions may appear later.)
An example chromatogram is shown below the flow diagram of an anion separation column. The horizontal axis is time. Time is drawn as time progresses to the left, with the time when the sample water is introduced as time zero. After sample introduction, a negative peak appears as a solvent peak. After returning to the eluent base, Cl- and NO3- peaks appear.
The height and area of each component peak in the chromatogram changes in proportion to the amount of ionic components contained in the sample water. In ion chromatography, the signal intensity is often measured as the peak area relative to the baseline.
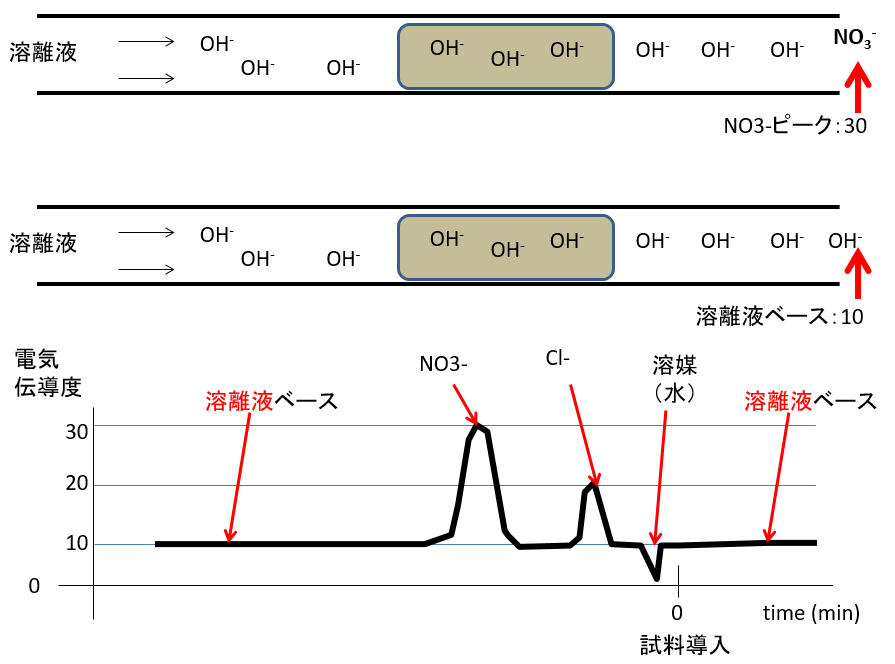
水water 試料導入Sample introduction
-
Column capacity saturation (upper limit of quantitation)
As with any analytical method, there is an upper limit of quantification. In chromatography, the upper limit of quantification is determined by the column capacity. (In addition, there is also an upper limit for quantification due to the detector capacity being exceeded.)
I will explain this using ion chromatography as an example. There is an upper limit to the amount of ions that can be retained on the surface of the ion exchange resin packed in the column. By increasing the number of ion exchange resins, the exchange capacity can be increased, but increasing the number will reduce sensitivity and accuracy. For higher sensitivity and higher accuracy, it is ideal to use as small a column as possible.
If the introduced sample water contains excessive ionic components, the ion exchange capacity of the column will be exceeded. What cannot be retained will simply flow away, making it impossible to separate it.
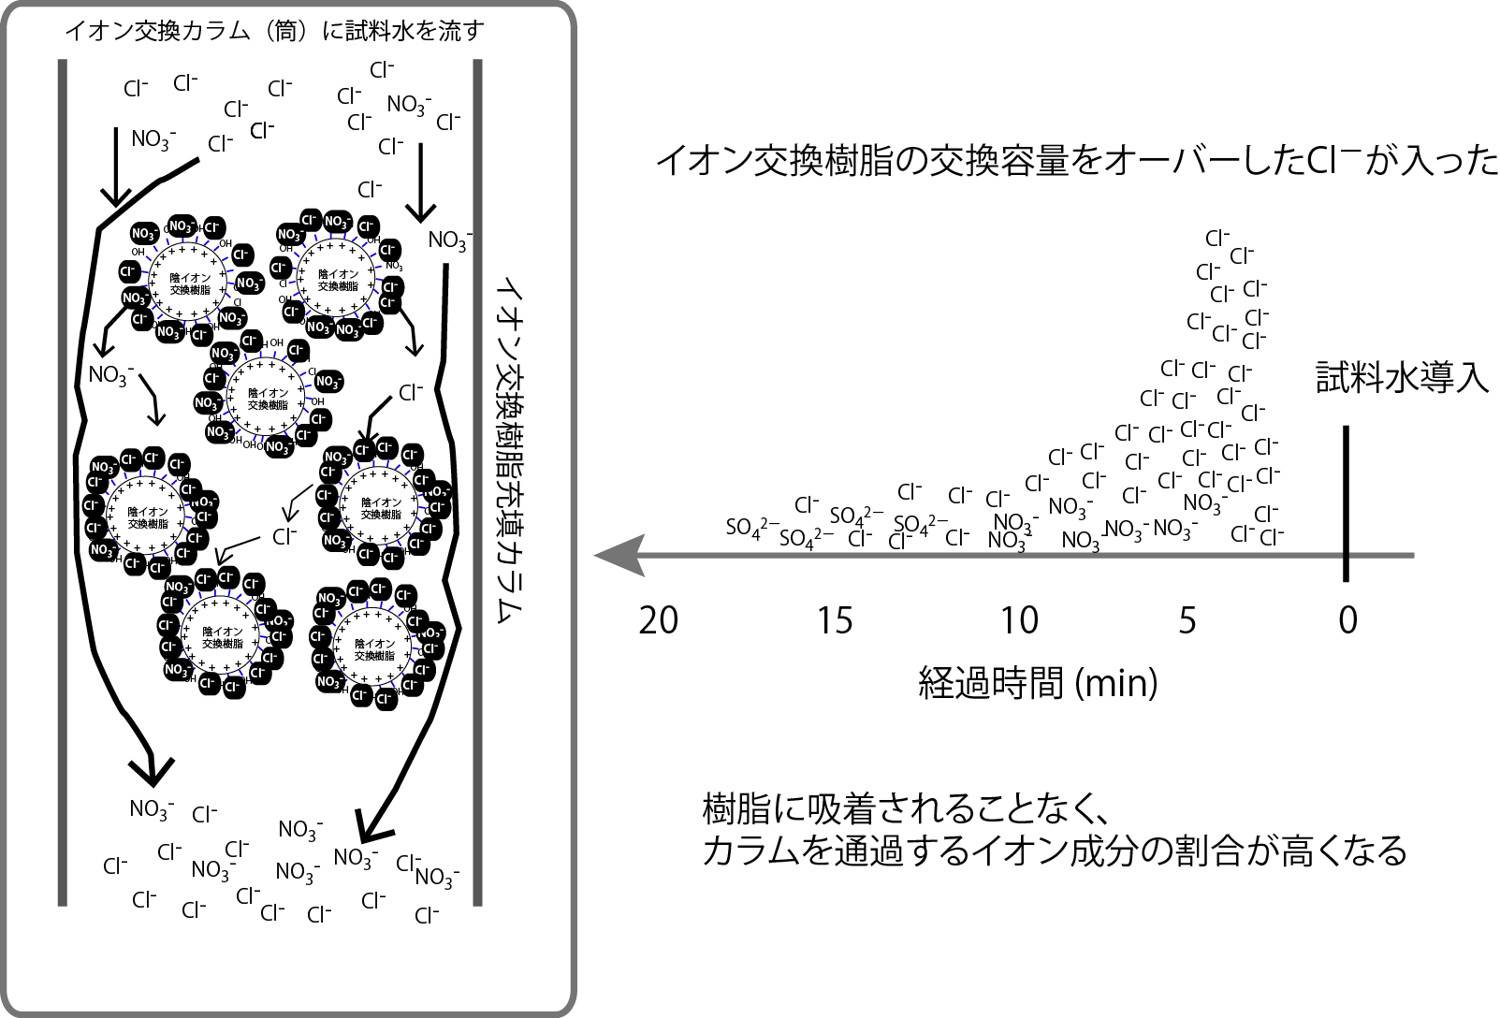
イオン交換カラム(筒)に試料水を流すPour the sample water into the ion exchange column (tube) イオン交換樹脂の交換容量をオーバーしたCl-が入ったCl- exceeded the exchange capacity of the ion exchange resin.
試料水導入Sample water introduction 経過時間elapsed time 樹脂に吸着されることなく、カラムを通過するイオン成分の割合が高くなるA higher percentage of ionic components pass through the column without being adsorbed by the resin.
-