
About significant figures and precision
Perfilado de sección
-
-
About significant figures and precision
In environmental analytical chemistry, accuracy control is particularly important. For example, consider the accuracy of CO2 measurements in the atmosphere and seawater. Since the Industrial Revolution, humans have diligently released CO2 into the atmosphere, and the global concentration of atmospheric CO2 has increased from 280 ppm to 380 ppm in less than 100 years. In other words, it increases by 1ppm every year. Expressing this as an annual rate, it is an increase rate of 0.3% yr-1. This is the global annual average value. If it is near a city, it will be subject to anthropogenic CO2 fluctuations, and if it is close to vegetation, it will be greatly affected by seasonal fluctuations due to photosynthesis and respiration (see the figure below). In order to observe CO2 in places with such strong fluctuations and discuss year-to-year changes, it is necessary to measure it with high precision.
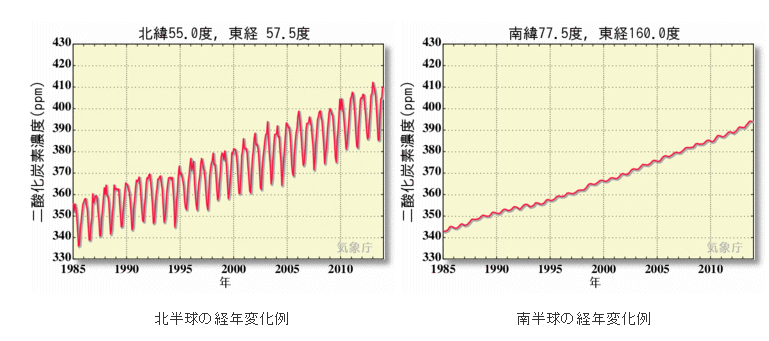
北緯north latitude 度degree 東経east longitude 南緯southern latitude 二酸化炭素濃度carbon dioxide concentration 北半球の経年変化例Example of secular change in the Northern Hemisphere 南半球の経年変化例Example of secular change in the Southern Hemisphere 年year
(From the Japan Meteorological Agency website)
When measuring CO2 in the atmosphere or seawater at a certain location, the required accuracy is at the ±0.3ppm level. Dividing this by the atmospheric concentration corresponds to ±0.08%.
(Even though the accuracy of the analyzer itself is higher, we want to ensure a total accuracy of ±0.3ppm from sample collection, analysis, and concentration determination using a calibration curve.)
When aiming for such high precision measurements, where are the sources of error? How does that error propagate and affect the results? must be seriously considered. Does the standard sample really guarantee the correct concentration? Accuracy control is necessary from the fundamental point of view.
-