
Figures
セクションアウトライン
-
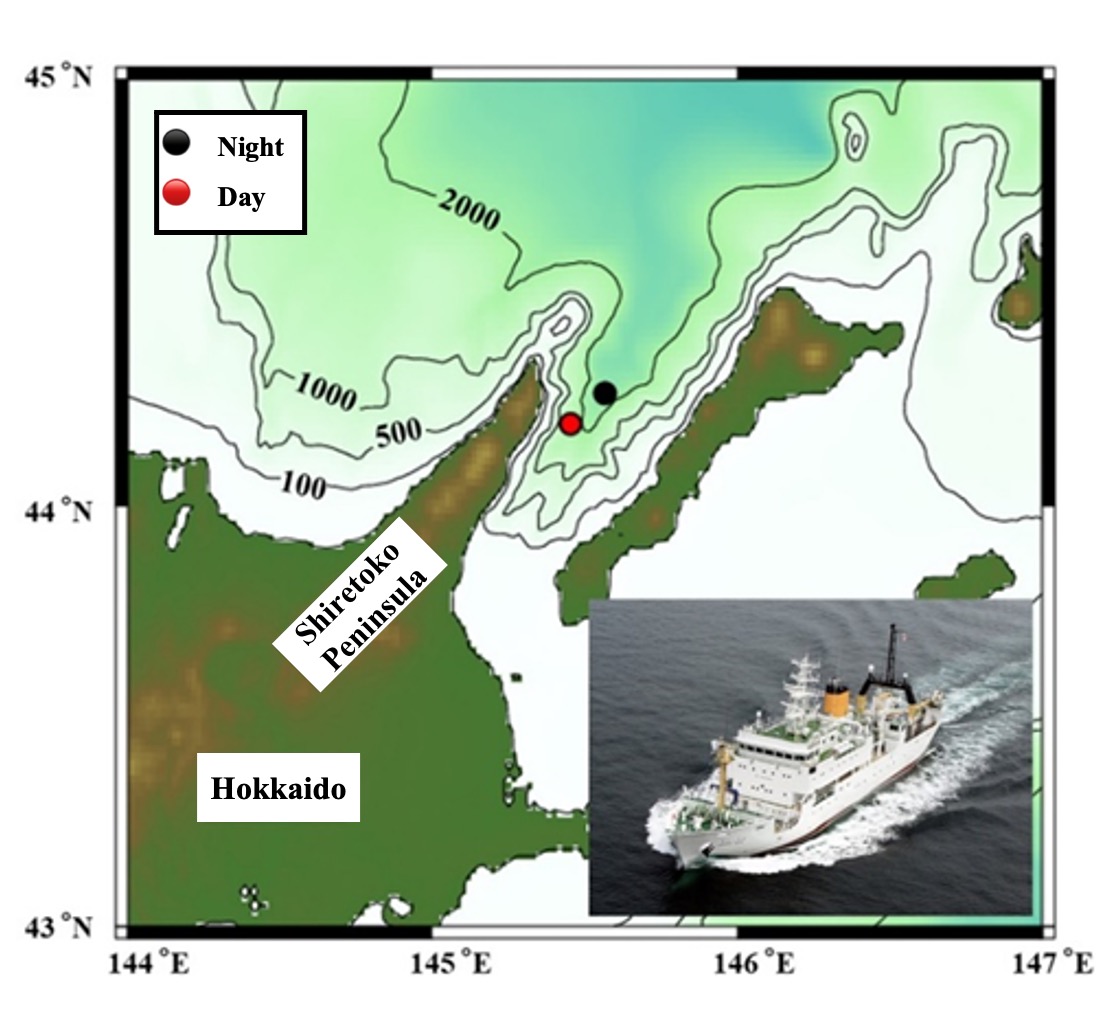
Figure 1. Sampling station for this study and the Oshoro-Maru, a training ship attached to the Faculty of Fisheries Sciences, Hokkaido University, where the sampling was conducted.
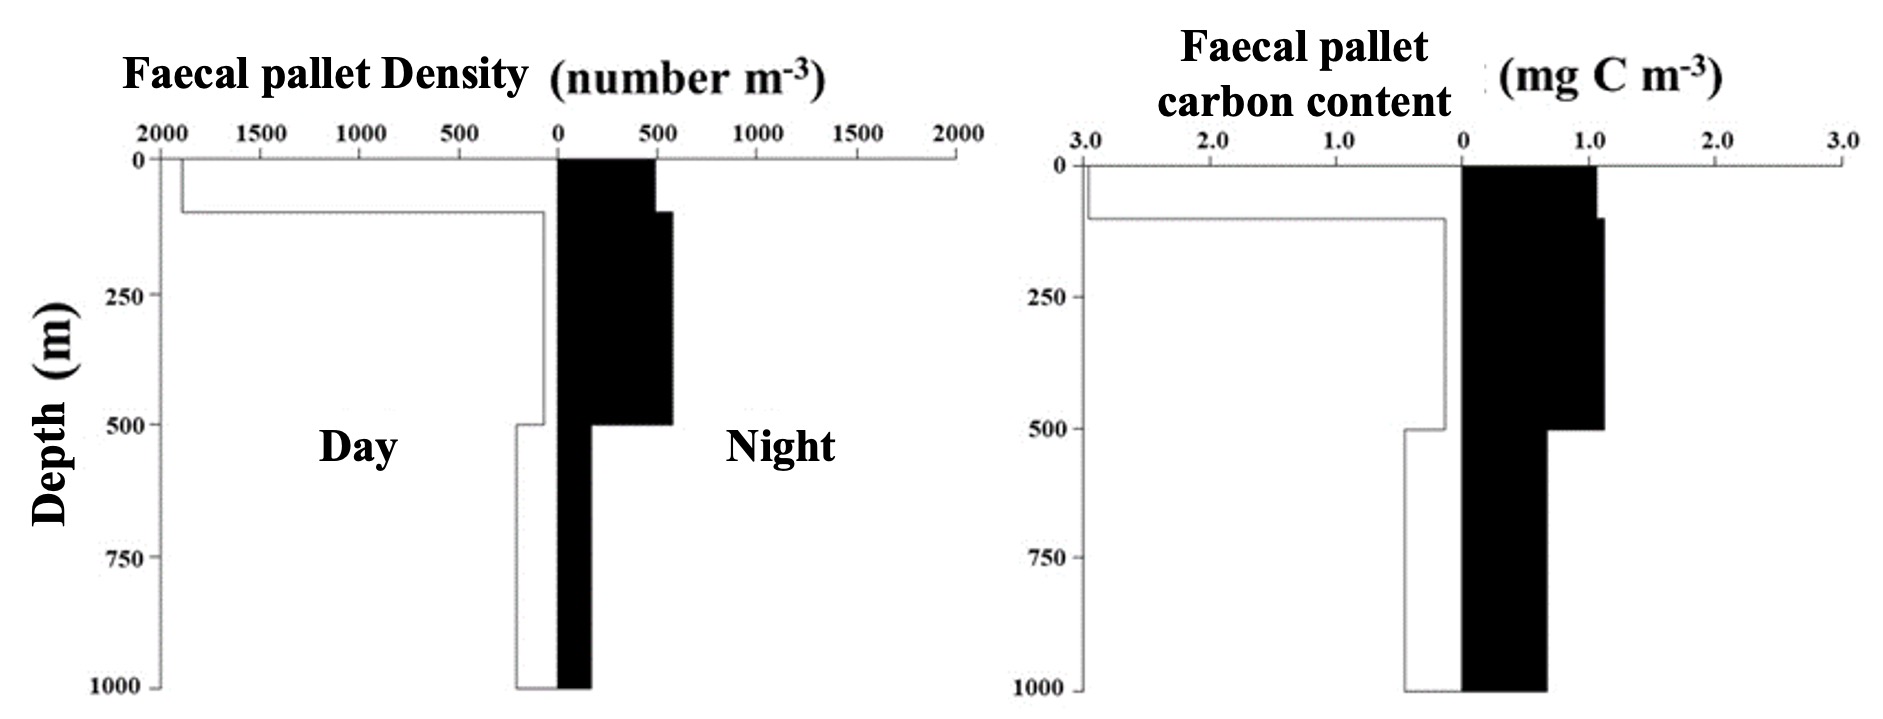
Figure 2. Day-night depth distribution of zooplankton fecal density (left) and carbon content (right) in the southern Sea of Okhotsk during summer. White indicates daytime, black indicates nighttime.
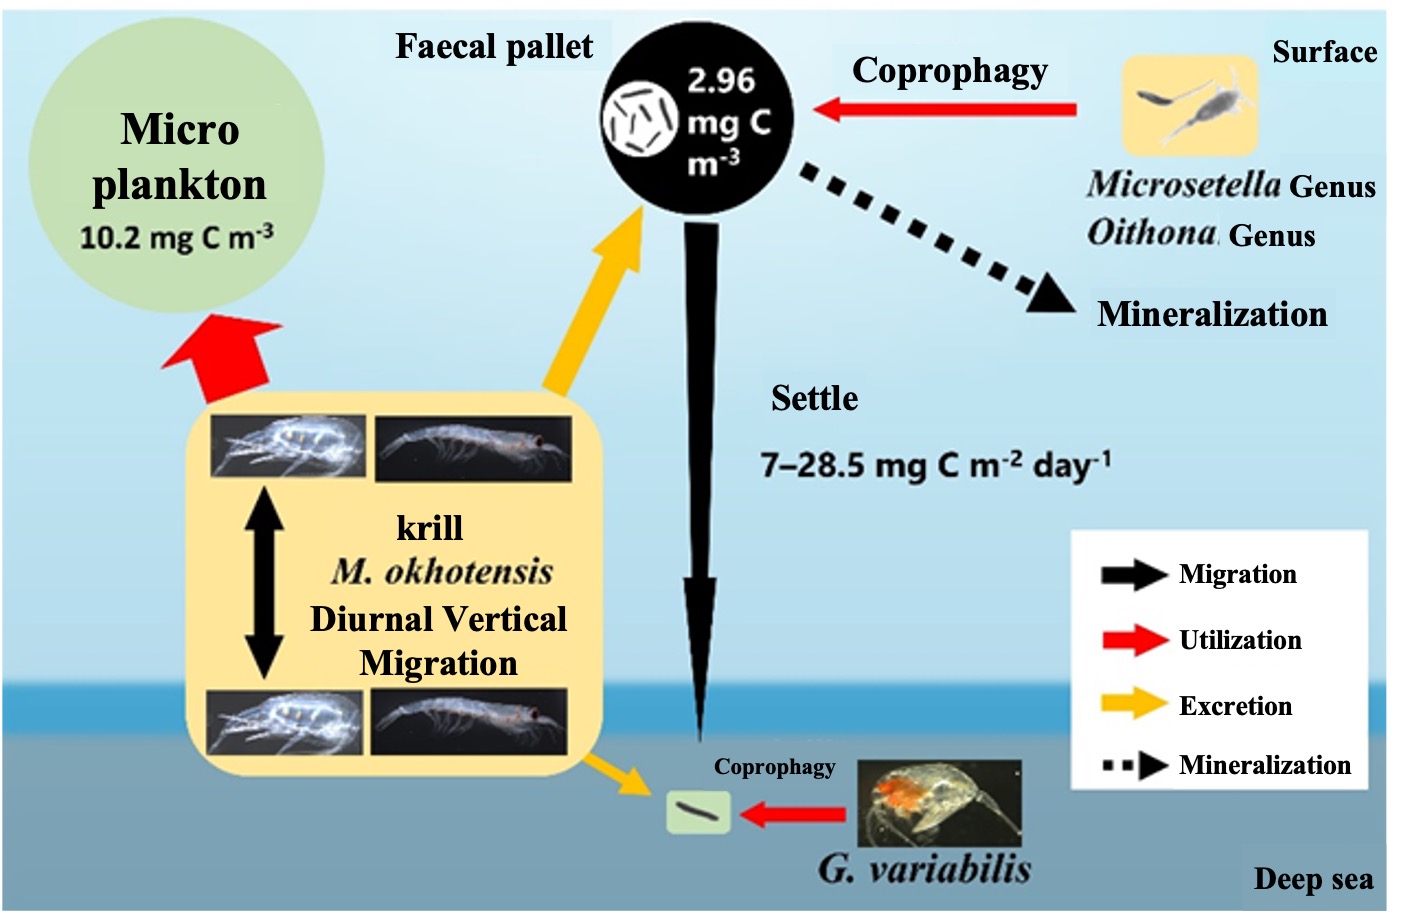
Figure 3. Schematic diagram of zooplankton biomass and mass transport through fecal grains in the southern Sea of Okhotsk during summer. All units of numbers in the figure are carbon content (mg C m-3 or mg C m-2 day-1).