
Time-series variation of organic carbon fluxes
セクションアウトライン
-
-
The mean organic carbon flux at station K2 for the entire period was 4.2 ± 4.8 mg m-2 day-1, with seasonal variation, high in spring to fall and low in winter (red line in Figure 2). This seasonal variation corresponded to the spring and fall phytoplankton blooms in the ocean surface layer. In addition, 12 maxima, which were clearly higher than the seasonal variability, were observed (blue circle in Figure 2). The relationship between organic carbon fluxes and sea surface chlorophyll concentrations 1-2 months prior to the fluxes suggests that 11 of the 12 observed organic carbon flux maxima were influenced by high magnitude phytoplankton blooms in the vicinity of K2.
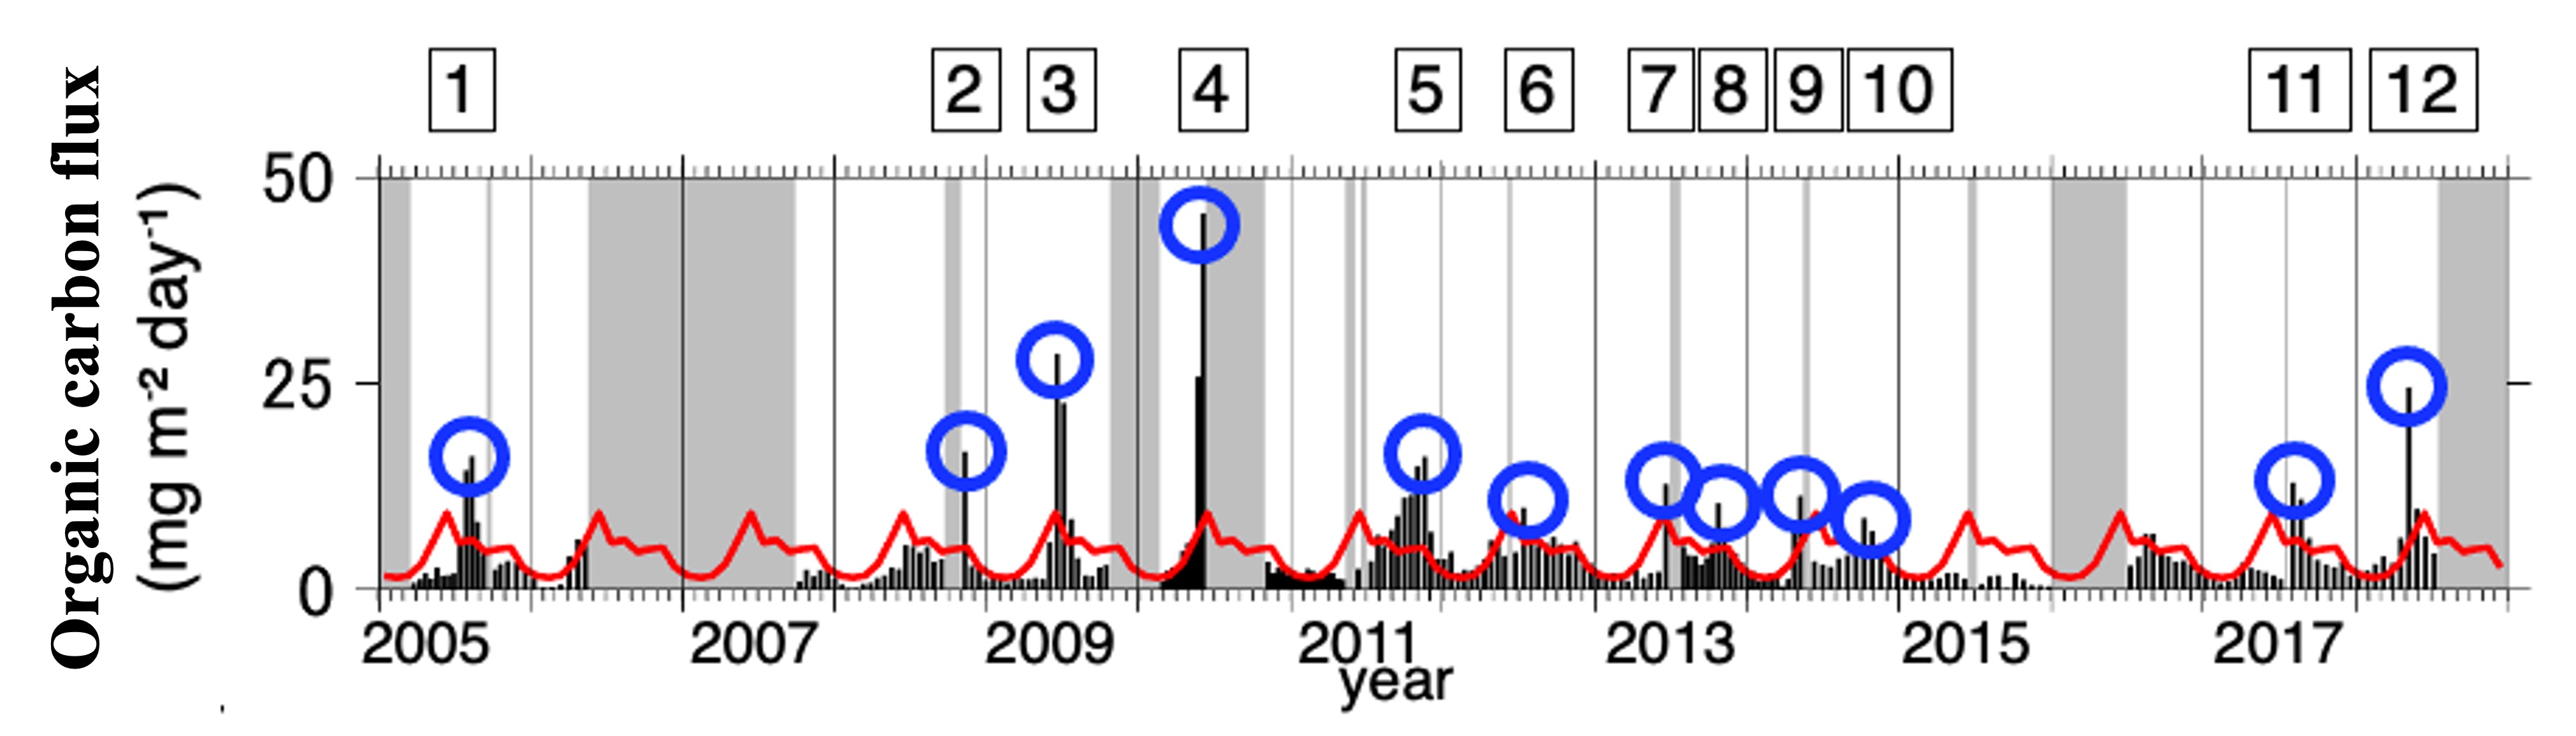
Figure 2: Time-series of organic carbon flux measured at K2 (black bars, unit: mg m−2 day−1). Red line represent seasonal variation. Shaded areas indicate the absence of sediment trap data. Blue circles and numbers represent data points considered as peaks in this study.
-