
Contents of this course
Section outline
-
-
Large phytoplankton blooms captured from satellites
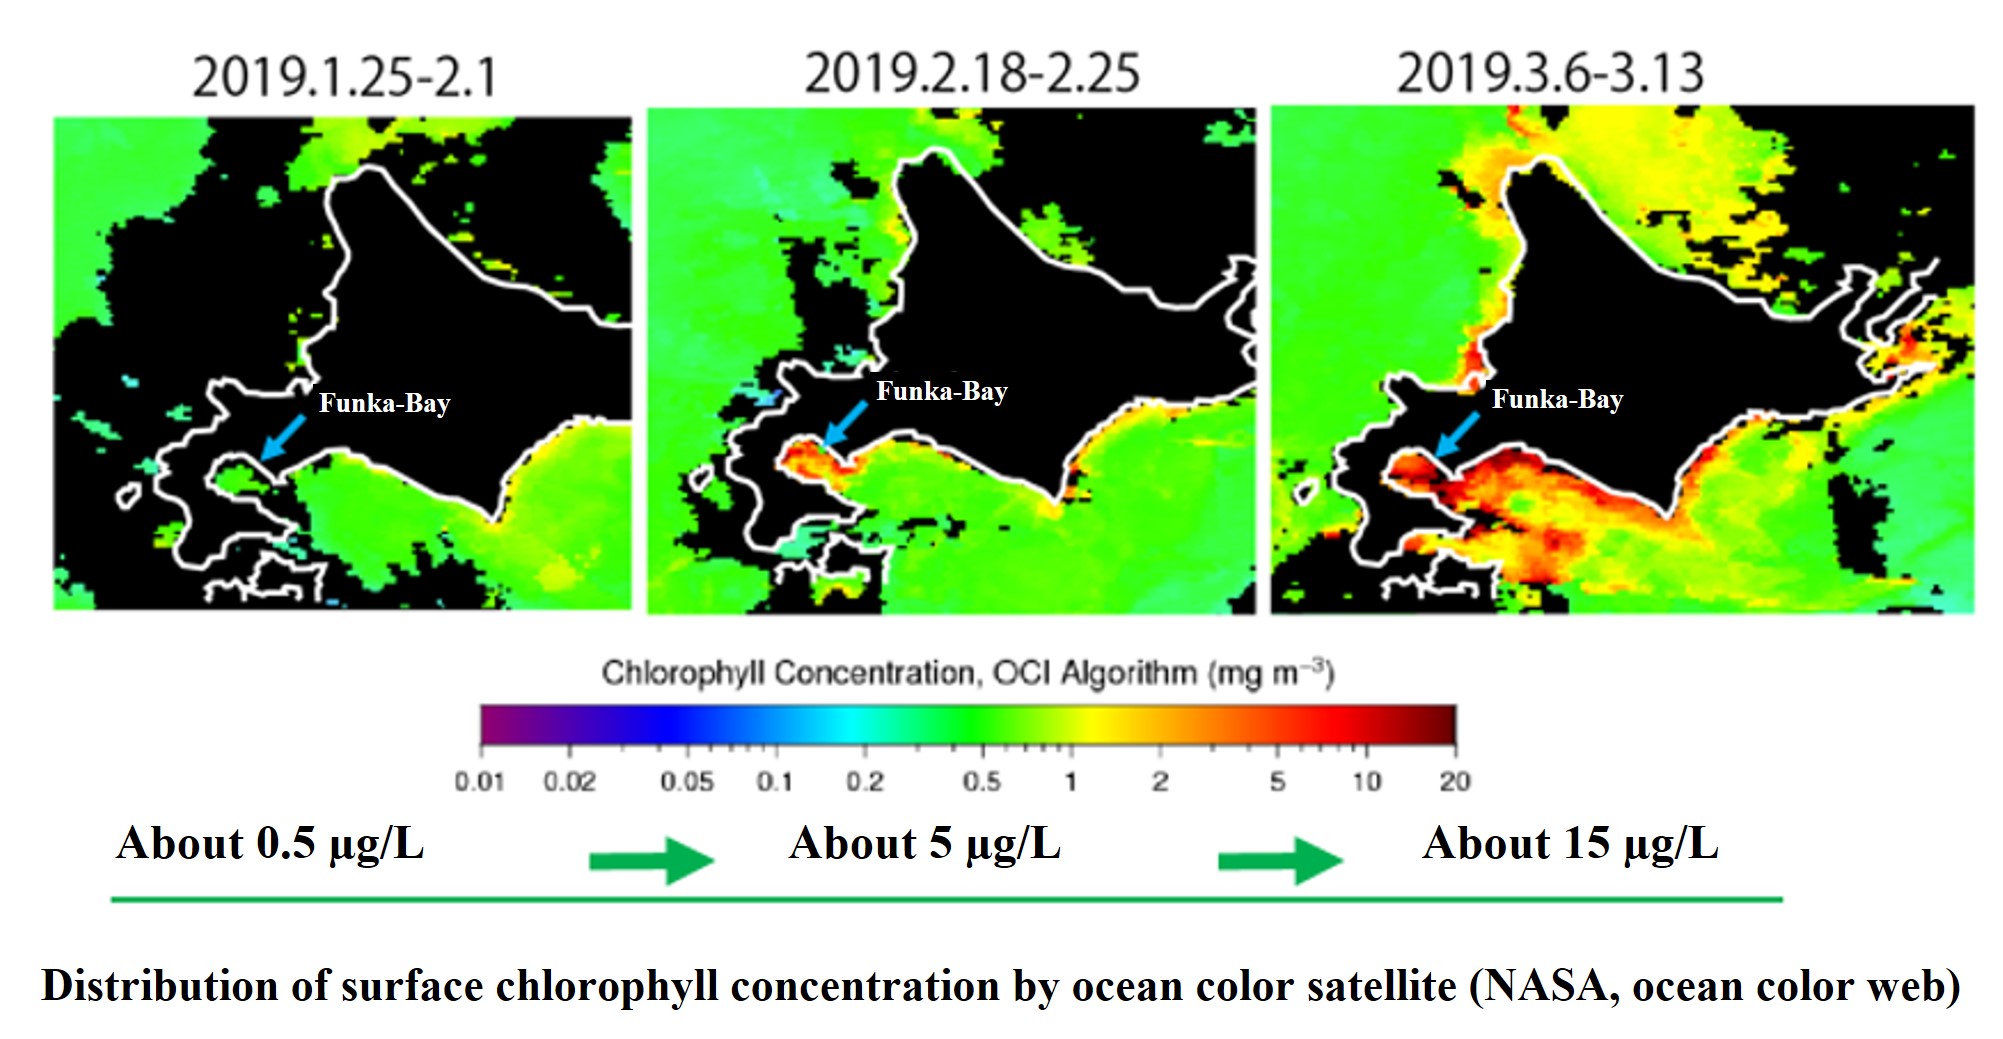
The figure below shows the results of satellite observations of ocean colors around Hokkaido. The warm colors (higher concentrations in the order of green, yellow, and red) represent areas of high photosynthetic pigment (chlorophyll) in plants. Chlorophyll concentrations in January are generally yellow-green (less than 1 μg/L = mg /m3), not very high for a coastal area. This suddenly increases from mid-February (below 10 μg/L), and by mid-March, the concentration is very high (below 20 μg/L). When the surface chlorophyll concentration exceeds 10 μg/L, you can see the greenish color just by looking at the sea surface from a vessel. Large blooms of diatoms (blooms) have been observed in Funka-Bay every year in early spring.
-
Oceanographic observation to collect water from spring diatom blooms and reproduce blooms
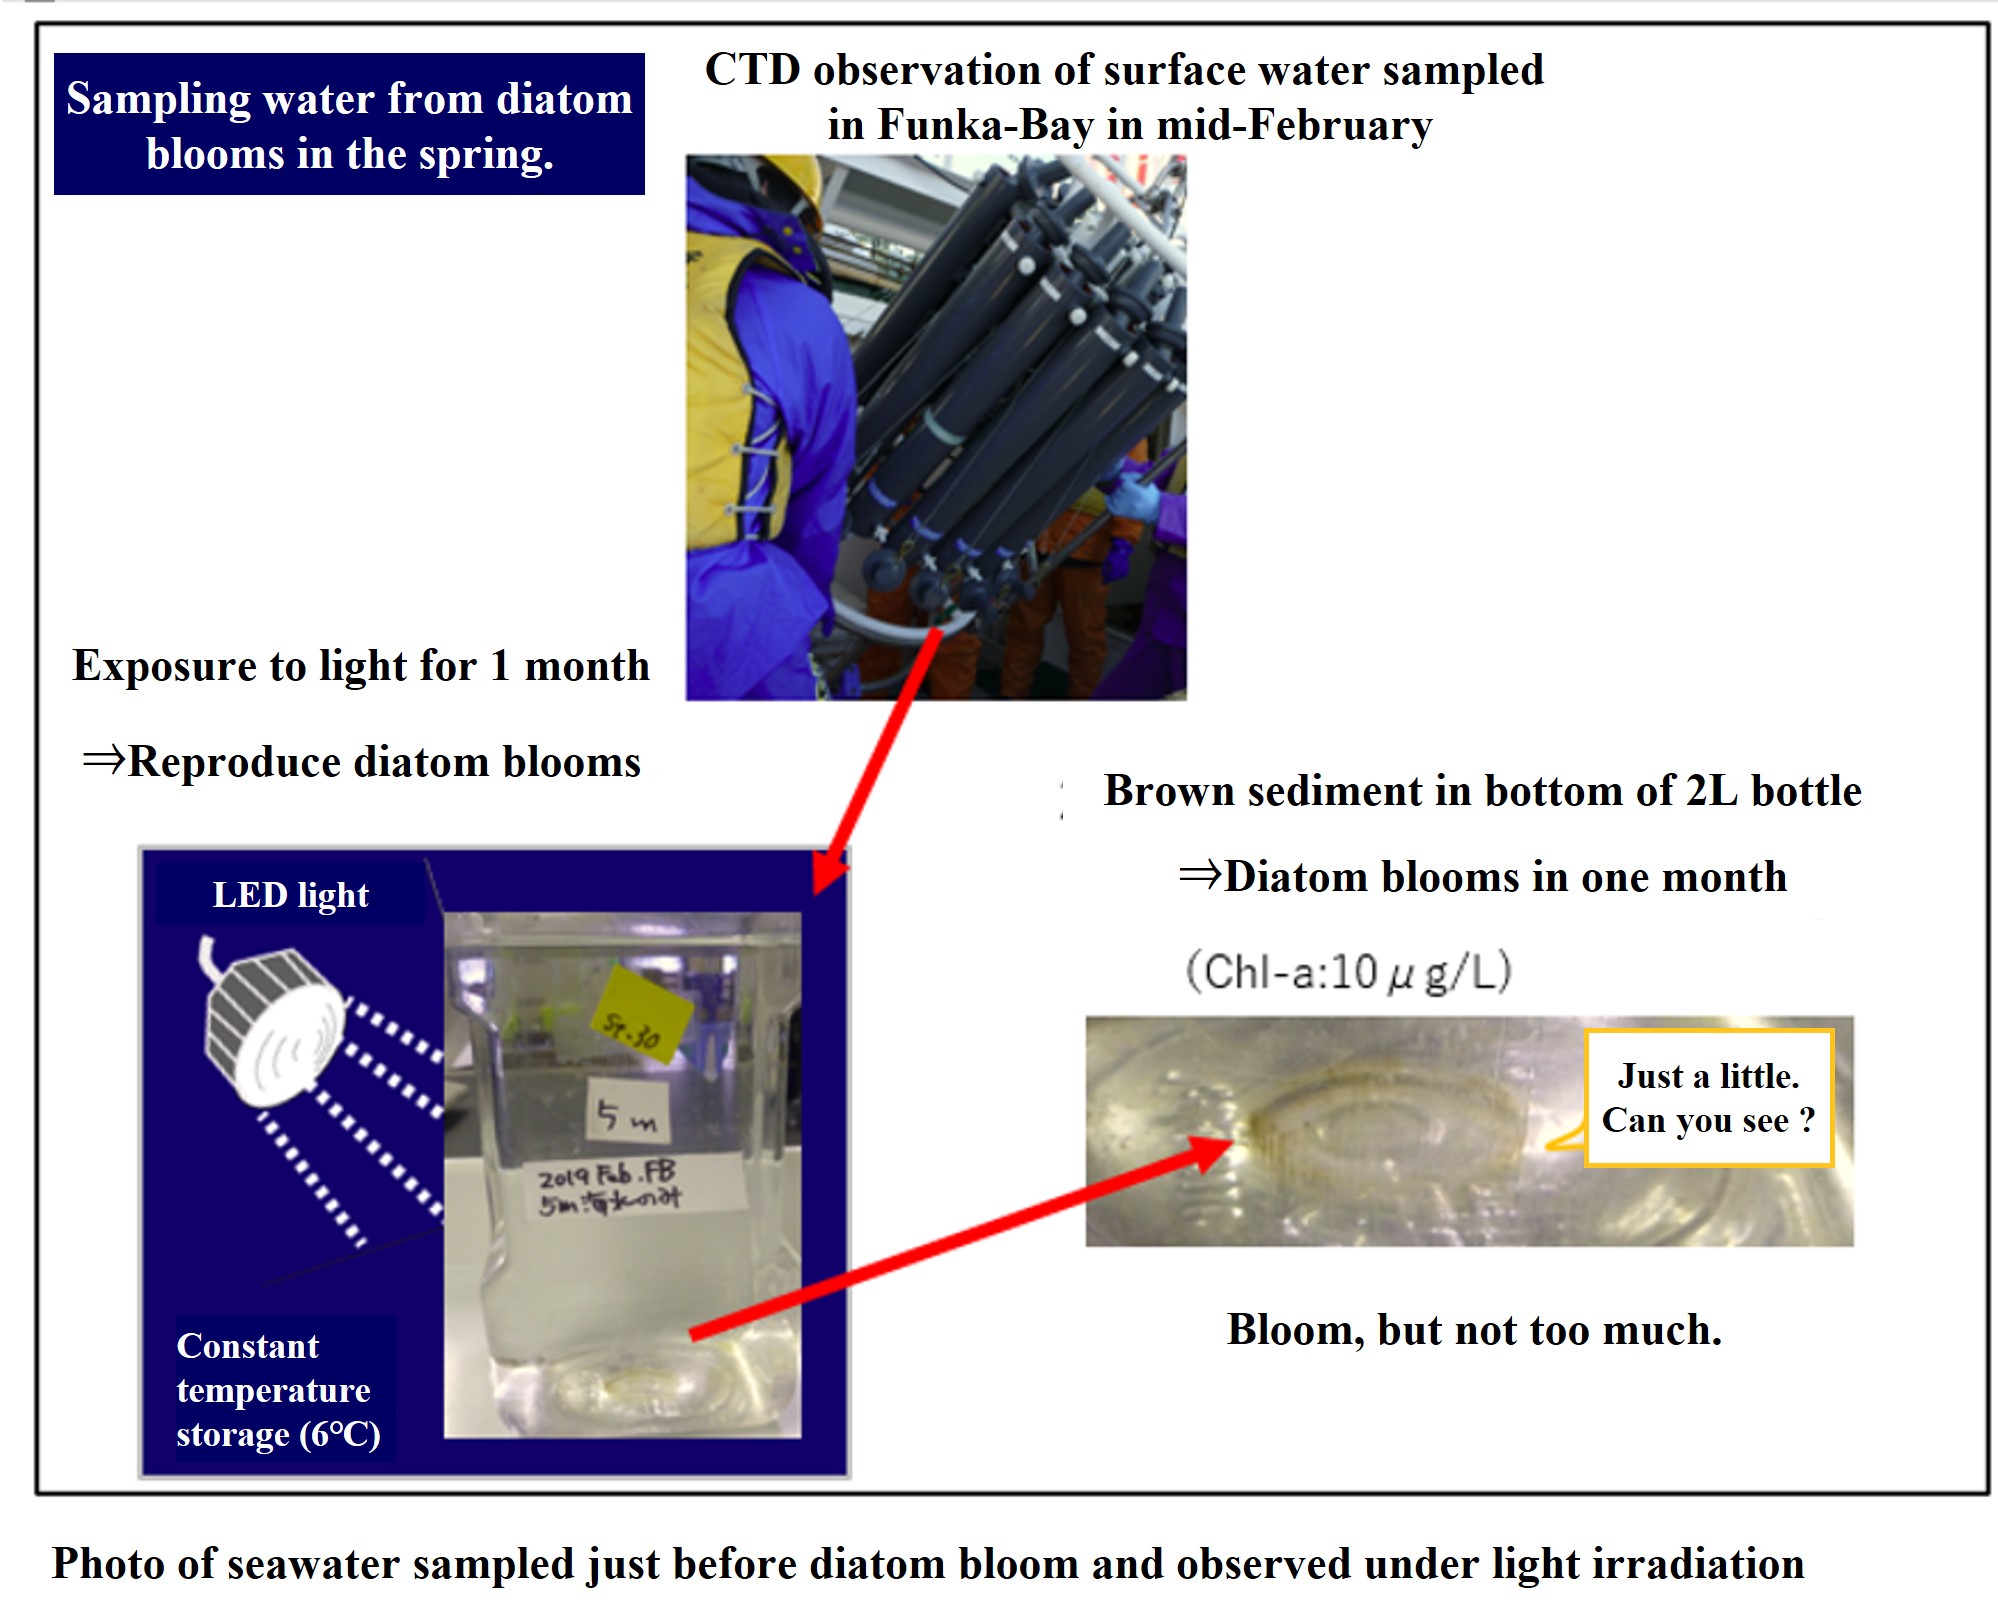
We sampled 2 L of surface seawater in Funka-Bay in mid-February 2019 and placed it in a clear bottle. One month later, we observed a diatom bloom occurring in Funka-Bay. We tried to reproduce the diatom bloom in the bottle by irradiating the surface water collected in mid-February with light. After one month, we observed only a small amount of diatom-like sediment at the bottom of the bottle. We filtered this one-month-old bottled seawater and measured the chlorophyll concentration, which was about the same as the actual bloom (10 μg/L). At the bottom of the bottle, you can only see a few faint diatoms precipitating. With only 2 L of seawater, the amount of diatom growth was quite small, even if it was a large increase. If the bottle is agitated, the diatoms will be invisible.
-
Plankton sampling during diatom bloom
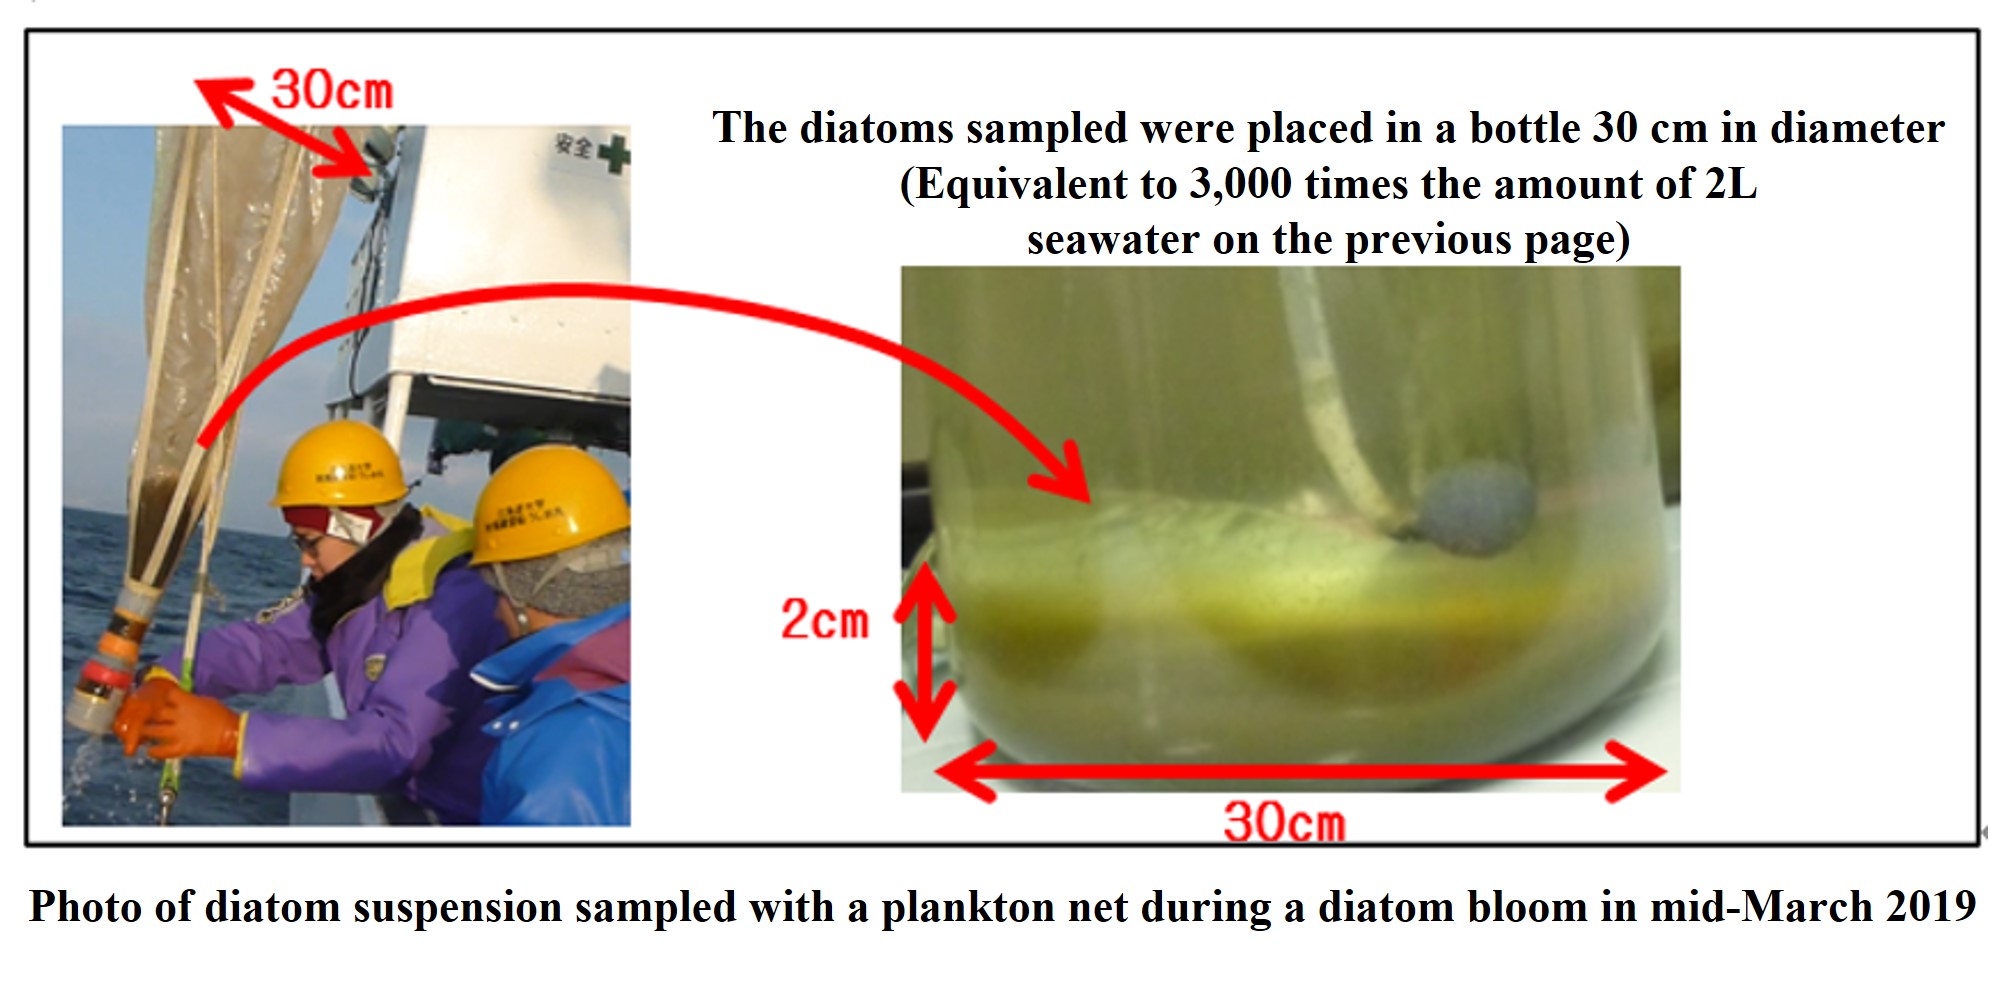
A phytoplankton bloom was observed in Funka-Bay in mid-March 2019. Diatom blooms are known to occur annually. A plankton net was towed vertically from the bottom (about 90 m) to the surface (0 m) of the Funka-Bay, yielding lots of diatom suspension (see left photo below). The plankton net was originally white. The entire net is covered with bedded diatoms, which collect in large numbers at the cot ends (tips). The diameter of the plankton net is 30 cm. When diatom suspensions collected in the net were placed in a bottle of the same diameter (right photo below), they were about 2 cm thick. It seems like a very large amount. The amount of seawater filtered by the plankton net is about 6,000 L, which is equivalent to 3,000 times more than the 2 L of seawater collected during the oceanographic observation shown earlier. If all the diatoms in the water were deposited on the seafloor, the diatom suspension would be as thick as the picture below.
-
Sea darkened by diatom blooms
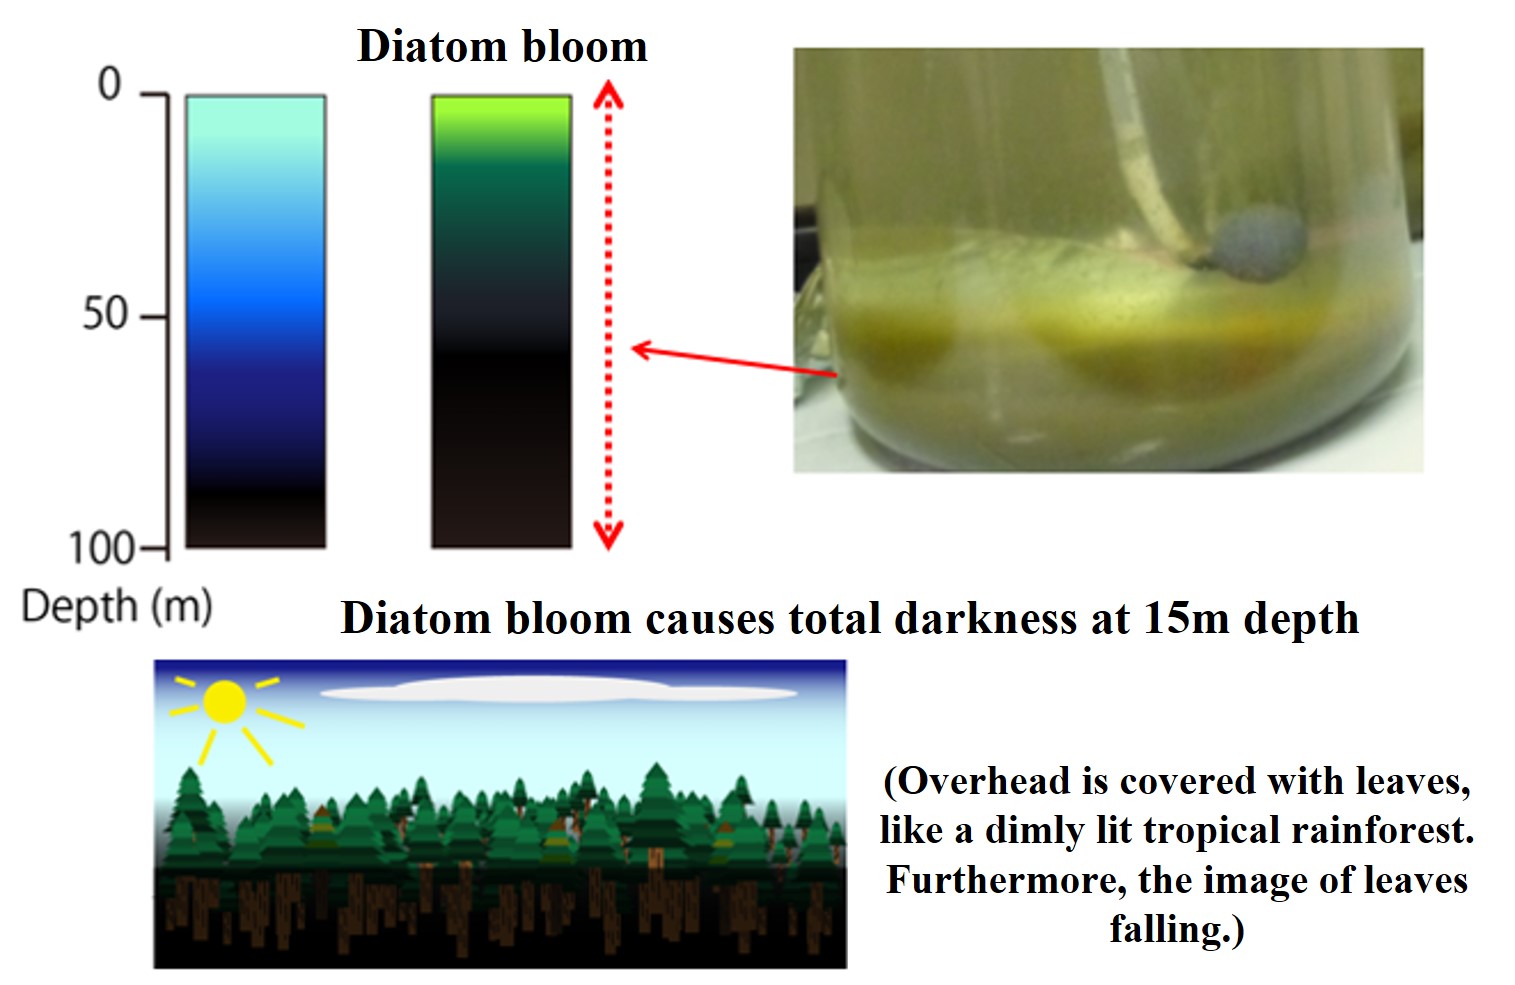
Sunlight incident from the ocean surface attenuates with depth as it is scattered by water molecules and absorbed by particulate matter. During periods of low phytoplankton, sunlight can reach depths of up to 50 m. During diatom blooms, however, sunlight can only reach depths of up to 15 m. At depths deeper than 15 m, light is blocked by diatom cells, resulting in total darkness.
-
Light transmission into surface mixed layer
During the subarctic winter (February), vertical mixing reaches about 100 m due to significant sea surface cooling. Since there are few particles (mainly phytoplankton) in the seawater, sunlight penetrating from the sea surface reaches a depth of about 50 m (approximately the depth at which the surface ratio reaches 1%). Under these conditions, half (50-100 m) of the mixed layer (0-100 m) is completely dark even during the daytime. In the spring, the sun is stronger, the sea surface is warmer, and the thickness of the mixed layer has increased to 30 m. Within the mixed layer, sufficient light is available during the daytime.
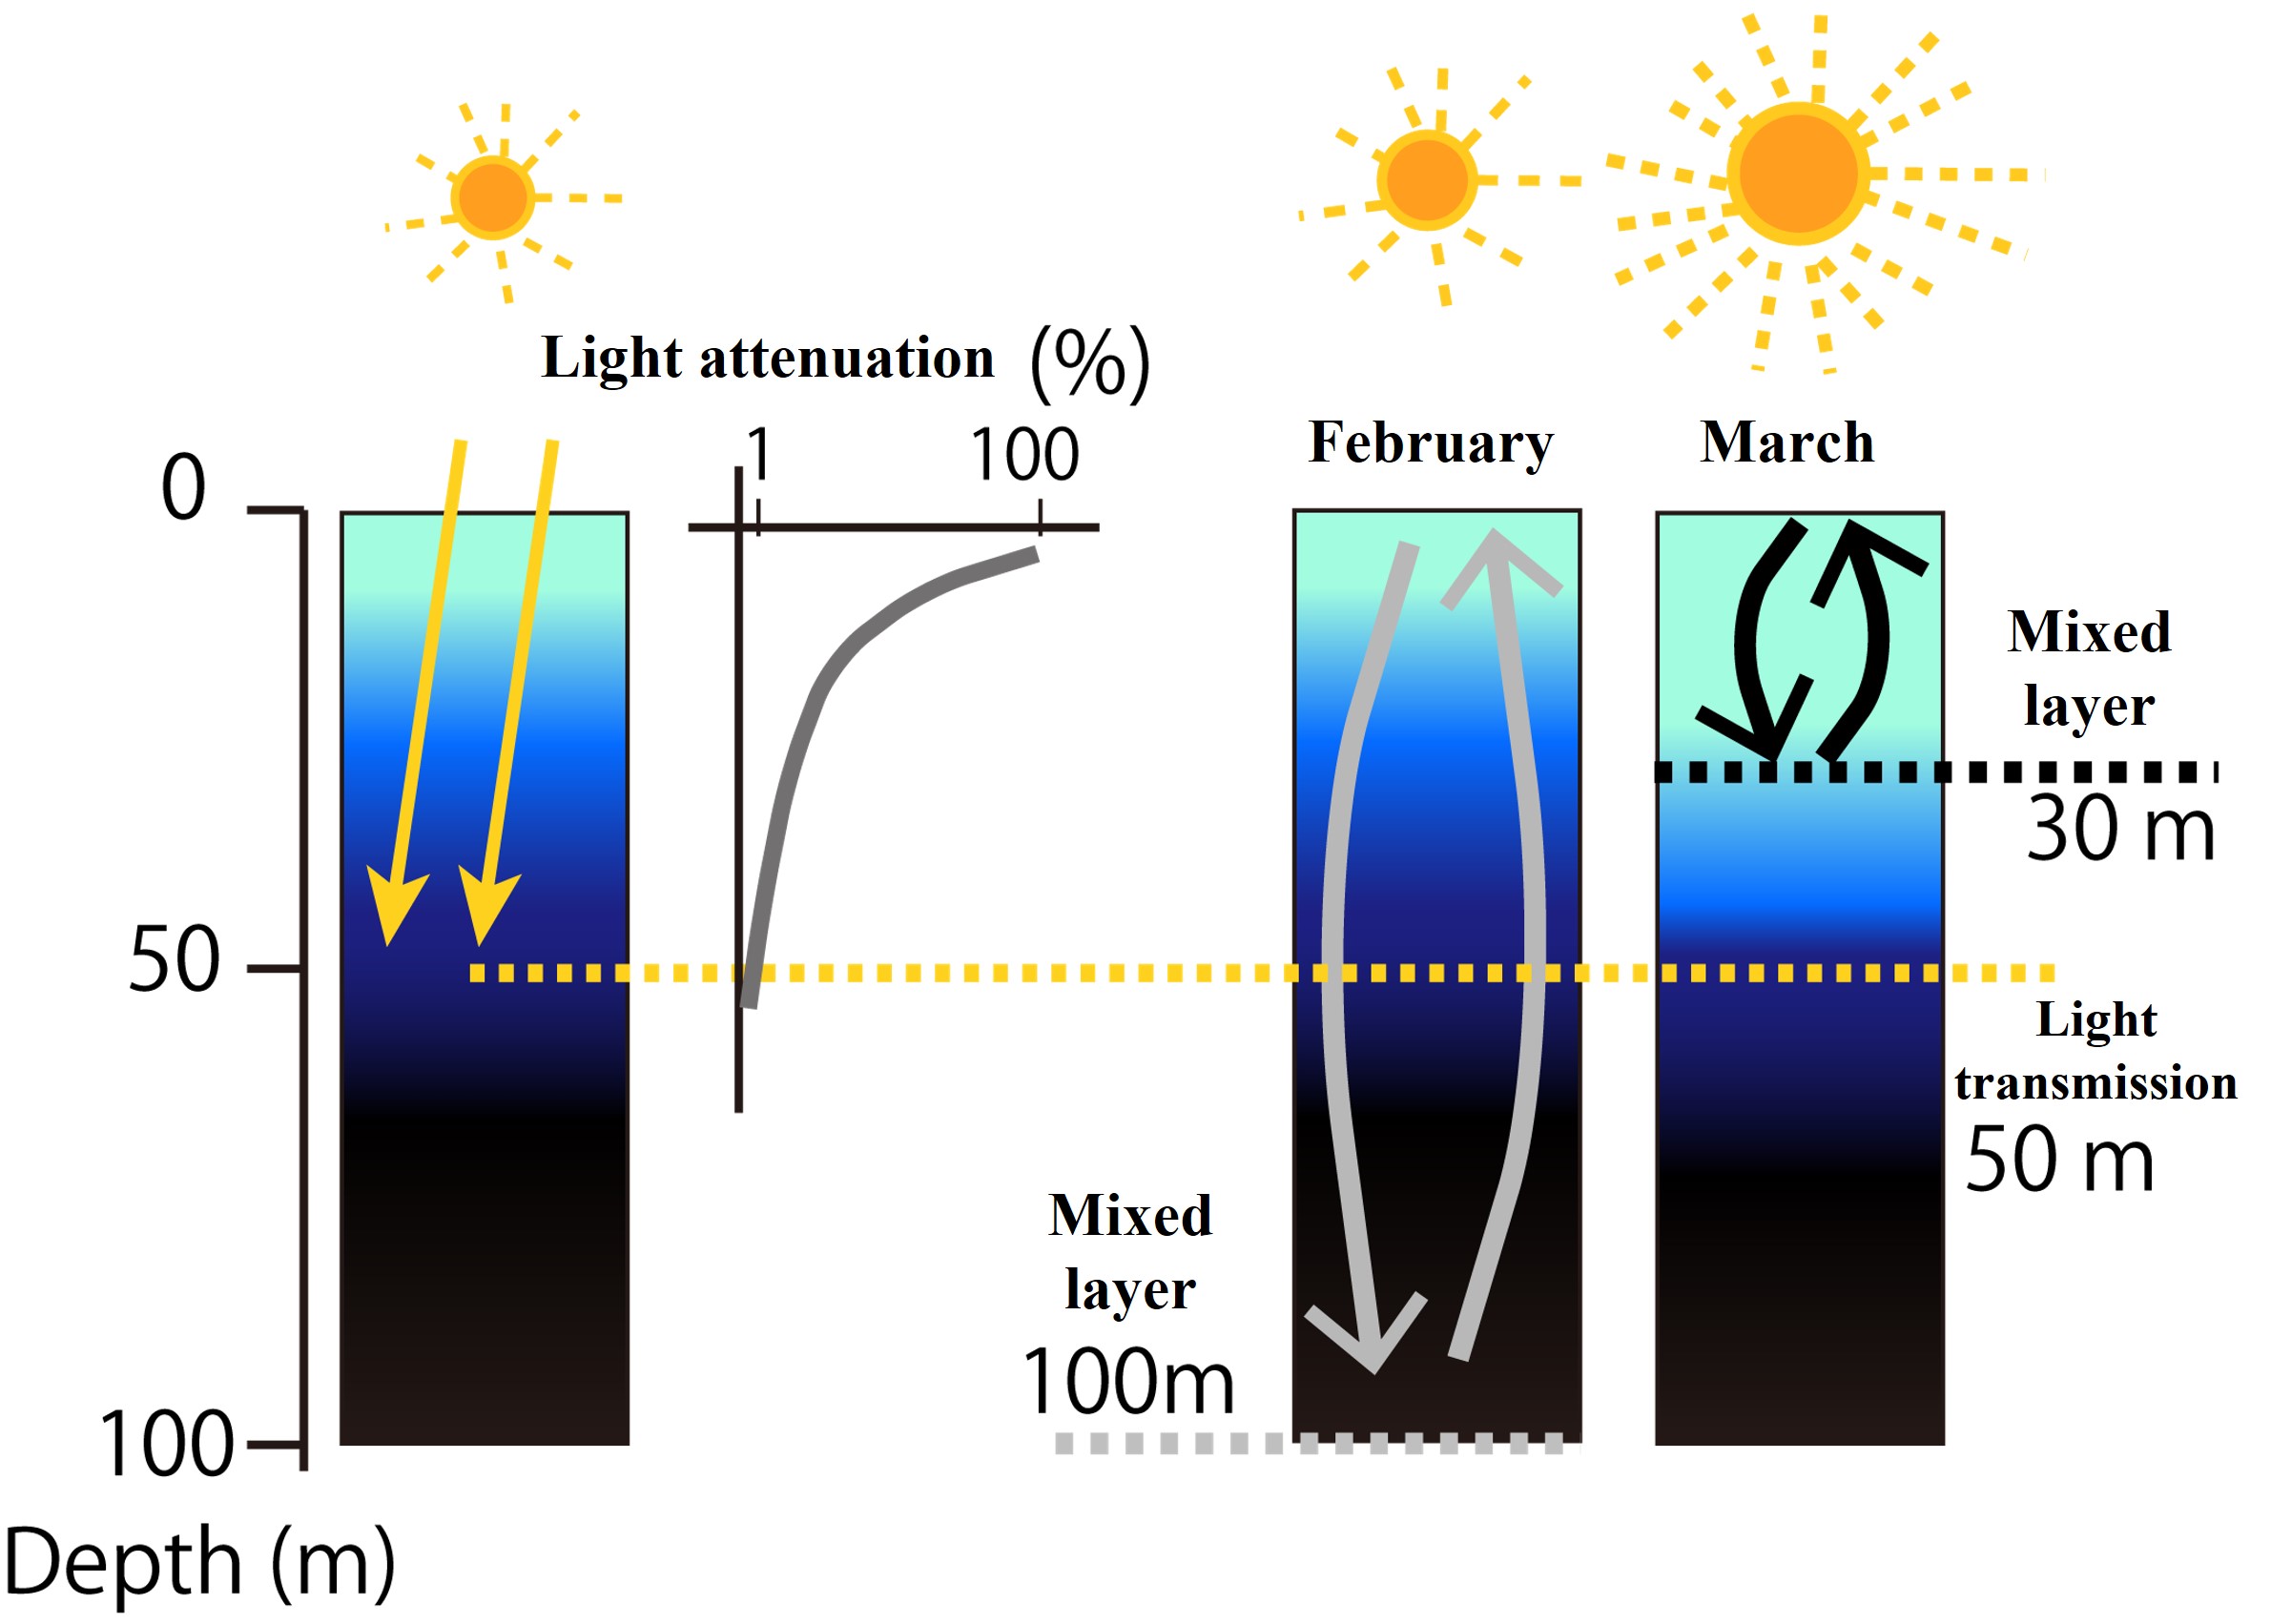
Assuming the same depth of light transmission (1% of light to surface ratio) in February and March, the amount of light pouring into the mixed layer increases rapidly in March because the mixed layer is shallower, the sunlight is stronger, and the length of daylight is longer.
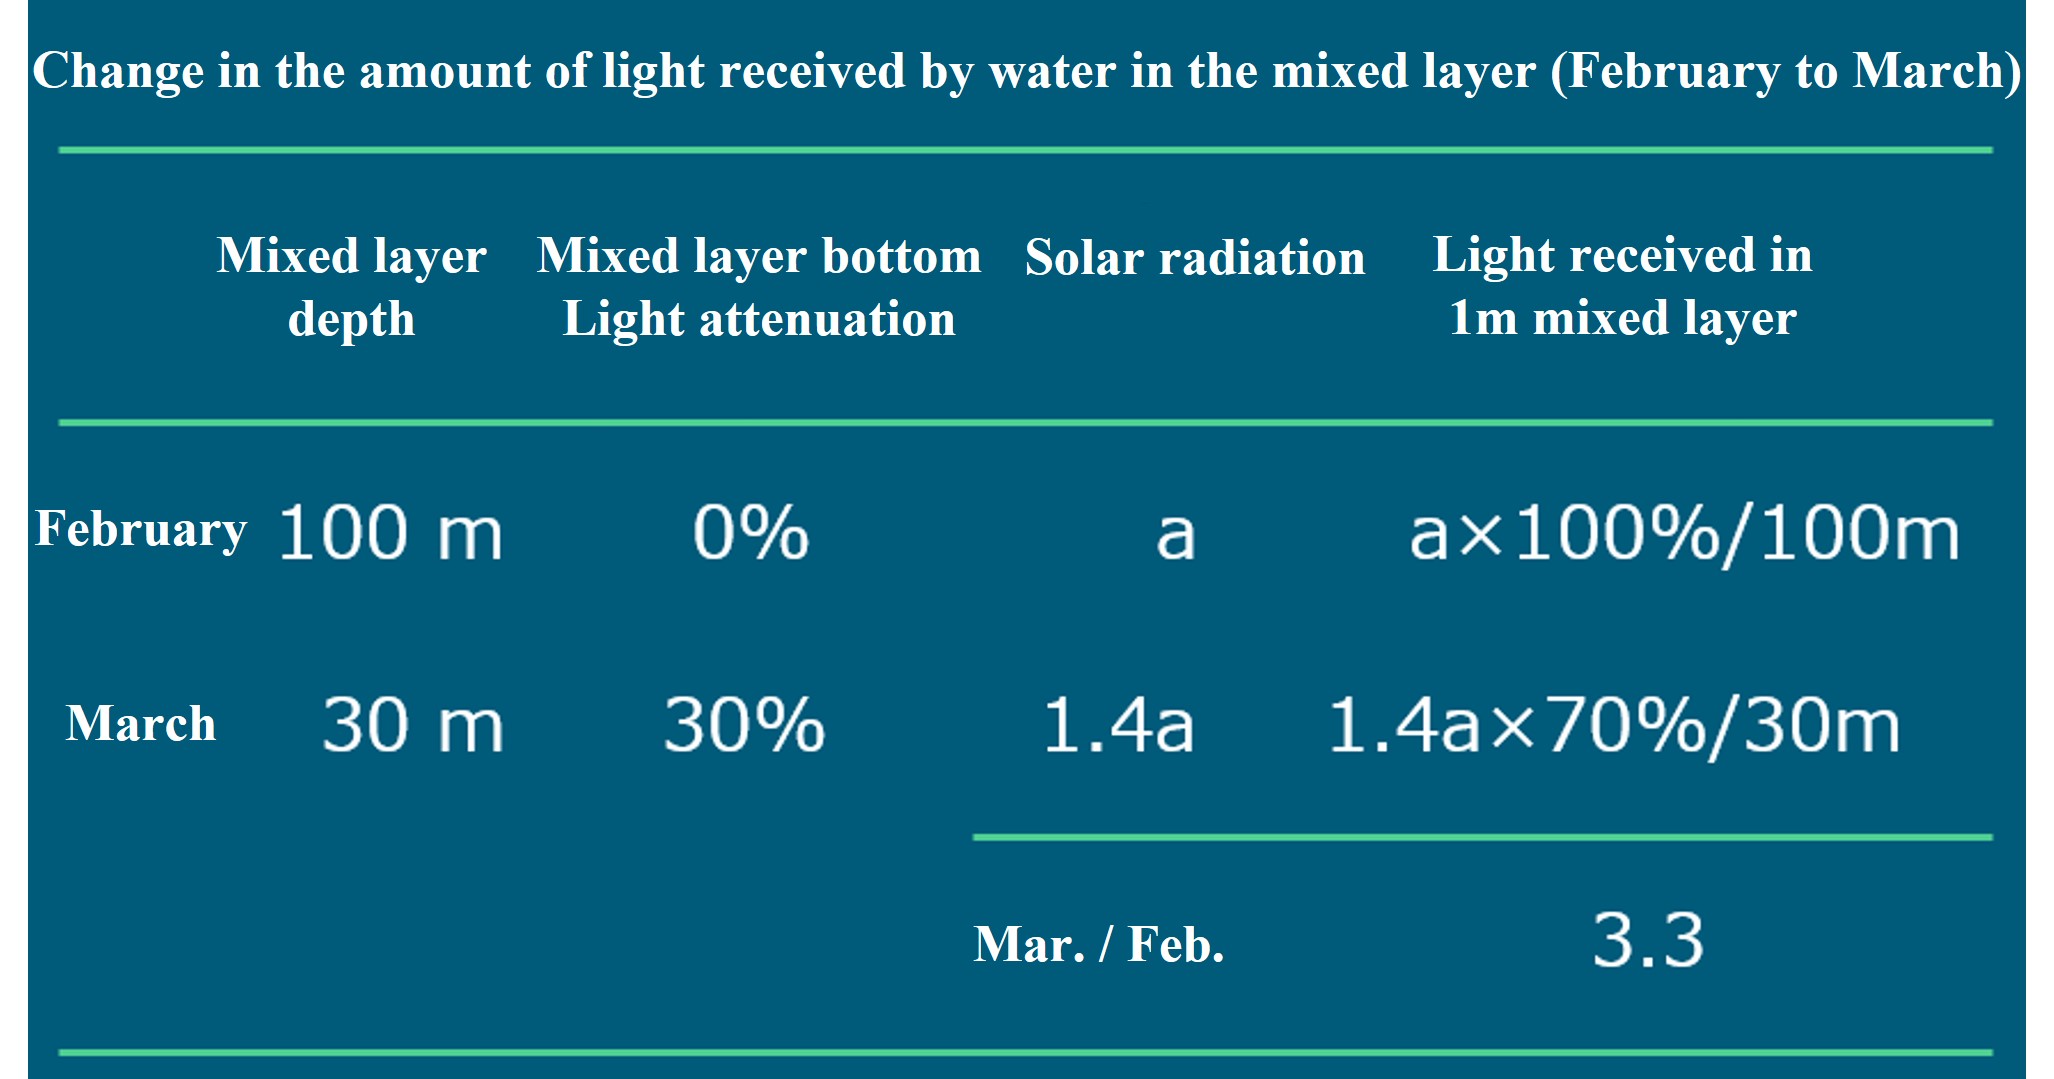
Change in the amount of light received within the mixed layer (February to March)In the table below, we have estimated how many times the amount of light received by the surface mixed layer water (per m) changes from February to March in the subarctic. From February to March, solar radiation increases by a factor of 1.4; if solar radiation in February is a, then solar radiation in March is 1.4a. In February, 100% of the light that enters the ocean surface is received on average within the mixed layer (100 m) (1% per meter). In March, the depth of the mixed layer is 30 m and the light attenuation rate (ratio of light to surface) at 30 m depth is 30%, 70% of the light that enters the ocean surface is received on average within the mixed layer (30 m) (2.3% per meter). The amount of light received per meter depth in the mixed layer in February and March is 1% x a and 2.3% x 1.4a (= 3.3% x a), respectively. 3.3 times more light is received in the mixed layer in March.
-
Mixed layer change and primary production
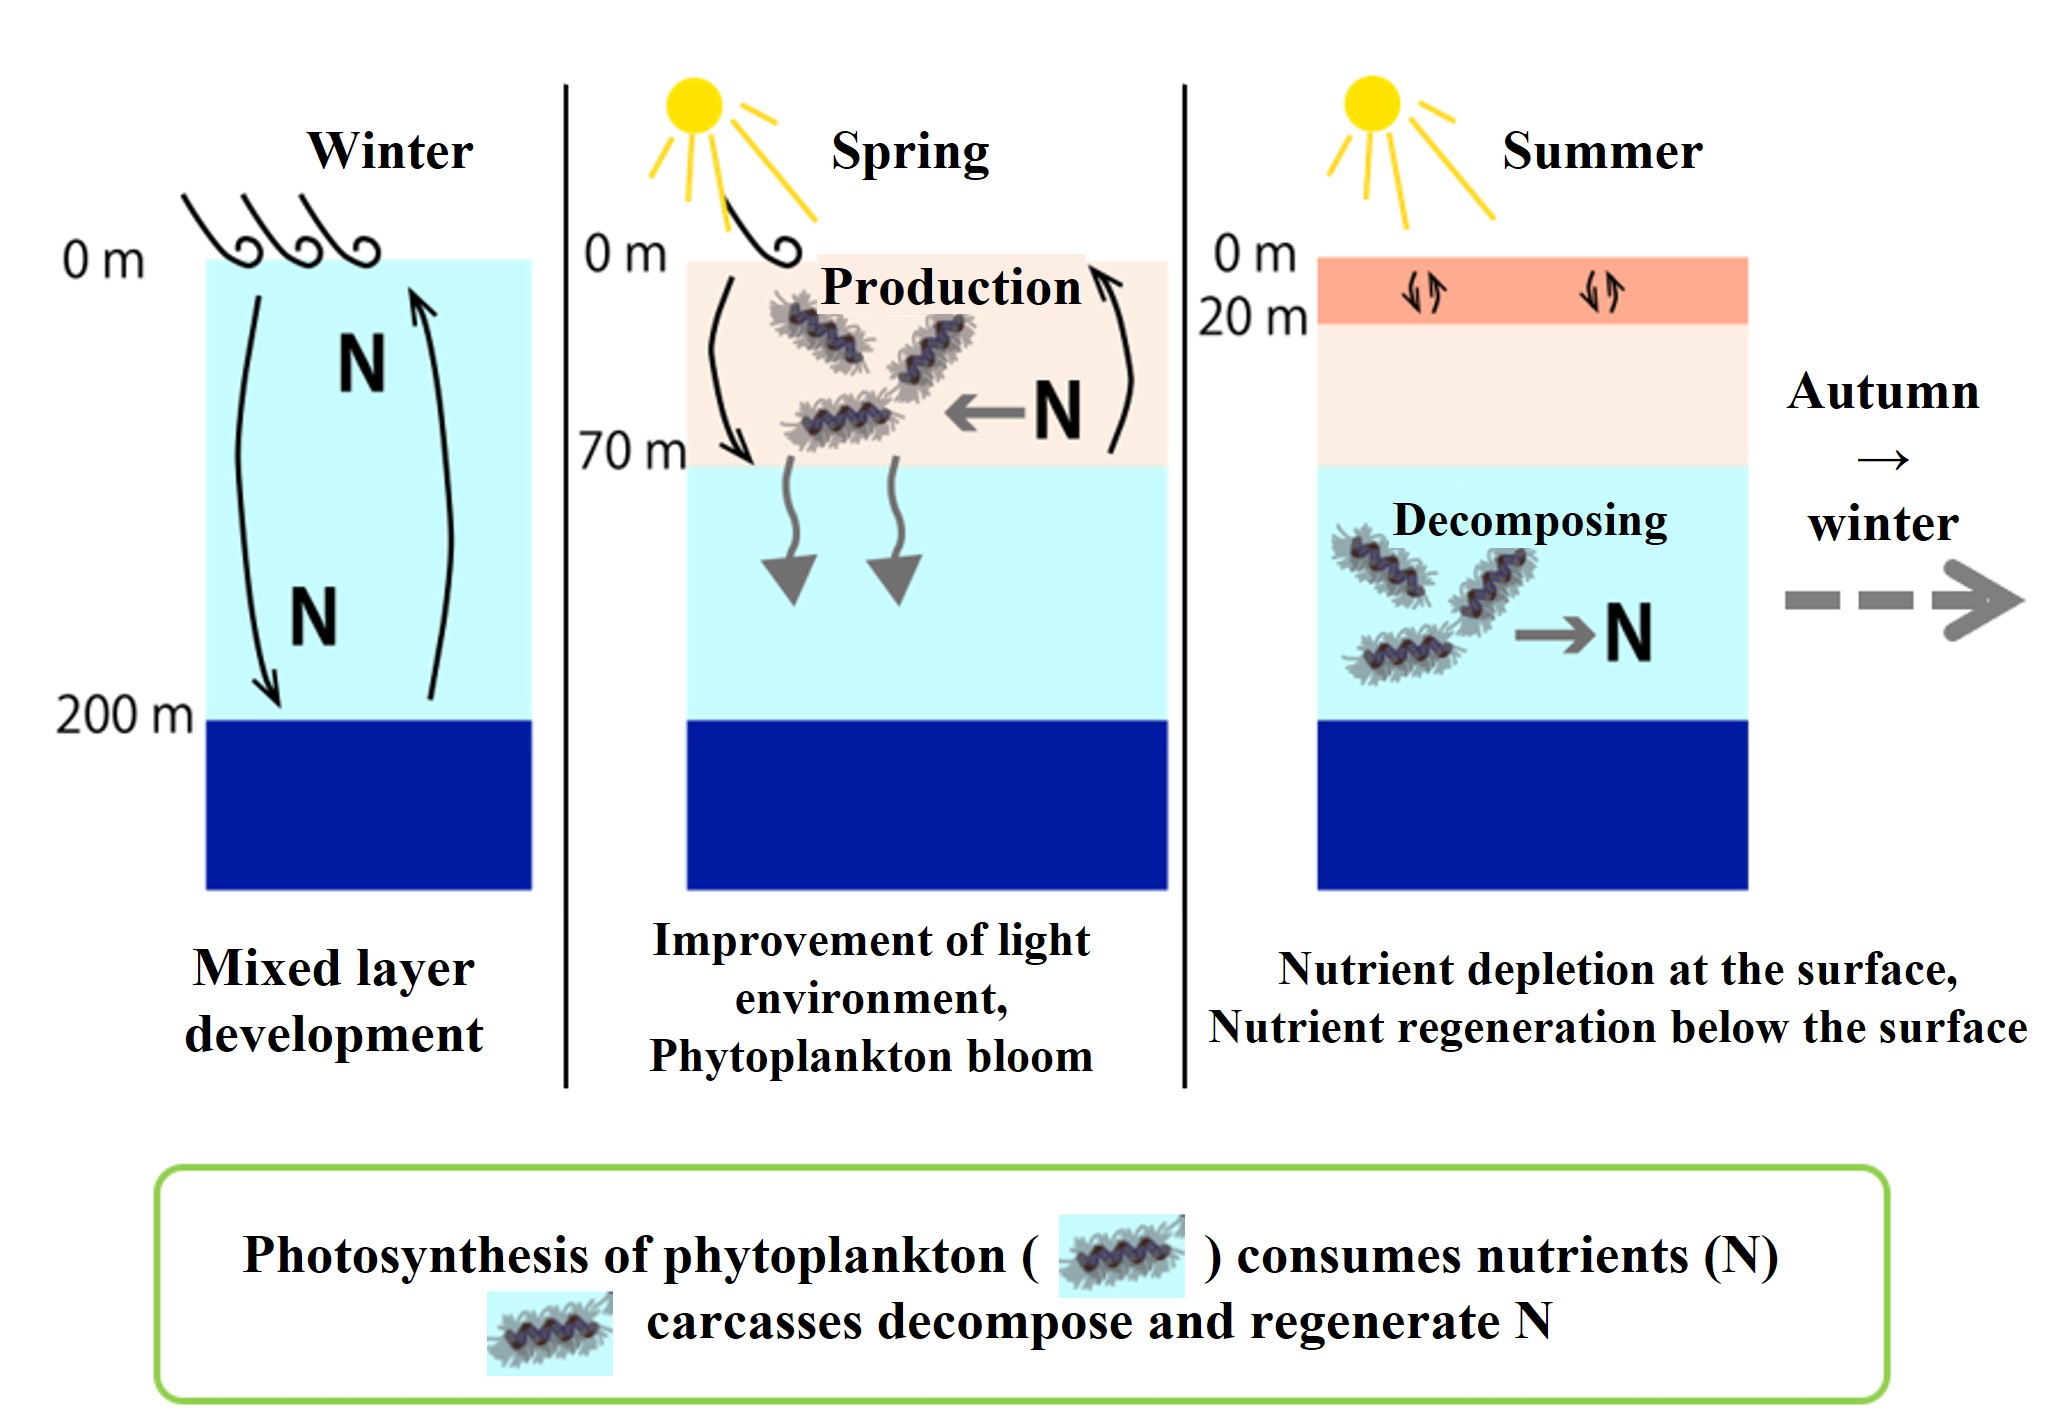
The production of organic matter by plants through photosynthesis is called basic or primary production. In addition to light, carbon dioxide, and water, nutrients are required for primary production. In the ocean, light and nutrient supply determine the spatiotemporal distribution of primary production. The figure below illustrates the relationship between nutrient (N) supply, regeneration, and primary production along with seasonal changes in vertical mixing.
Explanation of the above figure (explained in the order of fall, winter, spring, and summer)
【Autumn → Winter】Nutrients (N) accumulate below the mixed layer (deeper). As the mixed layer depth (200m) deepens in winter, nutrients (N) that have accumulated in deeper areas are taken up within the surface mixed layer. In winter, the water in the mixed layer is in a poor light environment on average because of the weak solar radiation and the movement of water to darker depths within the mixed layer (0 to 200 m). (Even during the day, when the water goes deeper within the mixed layer, it is not exposed to light)
【Winter → Spring】 In spring, the mixed layer becomes thinner (0-70 m) because the winds weaken and solar radiation increases. Furthermore, as the mixed layer becomes thinner, the light environment within the mixed layer becomes better (during the day, the water within the surface mixed layer is constantly exposed to light). The surface mixed layer has sufficient nutrients (N) to allow a large phytoplankton bloom (spring bloom) to occur. During the bloom, nutrients in the surface mixed layer are utilized by primary production. Once the diatom bloom is complete, the diatom population sinks below the mixed layer (sub-surface layer).
【Spring → Summer】 In early summer, the surface mixed layer becomes even shallower, depleting the surface nutrients and inhibiting phytoplankton growth. Even just below the mixed layer, sunlight penetrates and barely any nutrients remain. Photosynthesis occurs just below the mixed layer, and phytoplankton may be found in high densities. This phenomenon can be confirmed by the fact that chlorophyll, the photosynthetic pigment of phytoplankton, shows maximum in the "sub-surface layer" (deeper than the surface mixed layer). This is called the "sub-surface chlorophyll maximum. In most of the sub-surface layer (where little photosynthesis occurs), nutrients are regenerated by the death and decomposition of deposited phytoplankton cells. This is why nutrient concentrations are higher deeper than in the mixed layer.
【Summer → Autumn】 In the autumn, vertical mixing becomes more active due to lower temperatures and weather disturbances. Nutrients are brought to the surface and autumn blooms may be seen.
【Autumn → Winter】 In winter, nutrients accumulated in the sub-surface layer are brought to the surface by vertical mixing.
-
Definition of a euphotic layer (Remember!)
When considering marine ecology, it is important to define the "euphotic layer". In oceanography, the term "euphotic layer" generally used is not "light-bearing layer," but rather "layer in which photosynthesis is effective". In other words,
Inside the euphotic layer :【Photosynthesis】>【Respiration】
Euphotic layer depth (compensation depth):【Photosynthesis】=【Respiration】(Sunlight 0.5-1% depth)
Deeper layer than that :【Photosynthesis】<【Respiration】
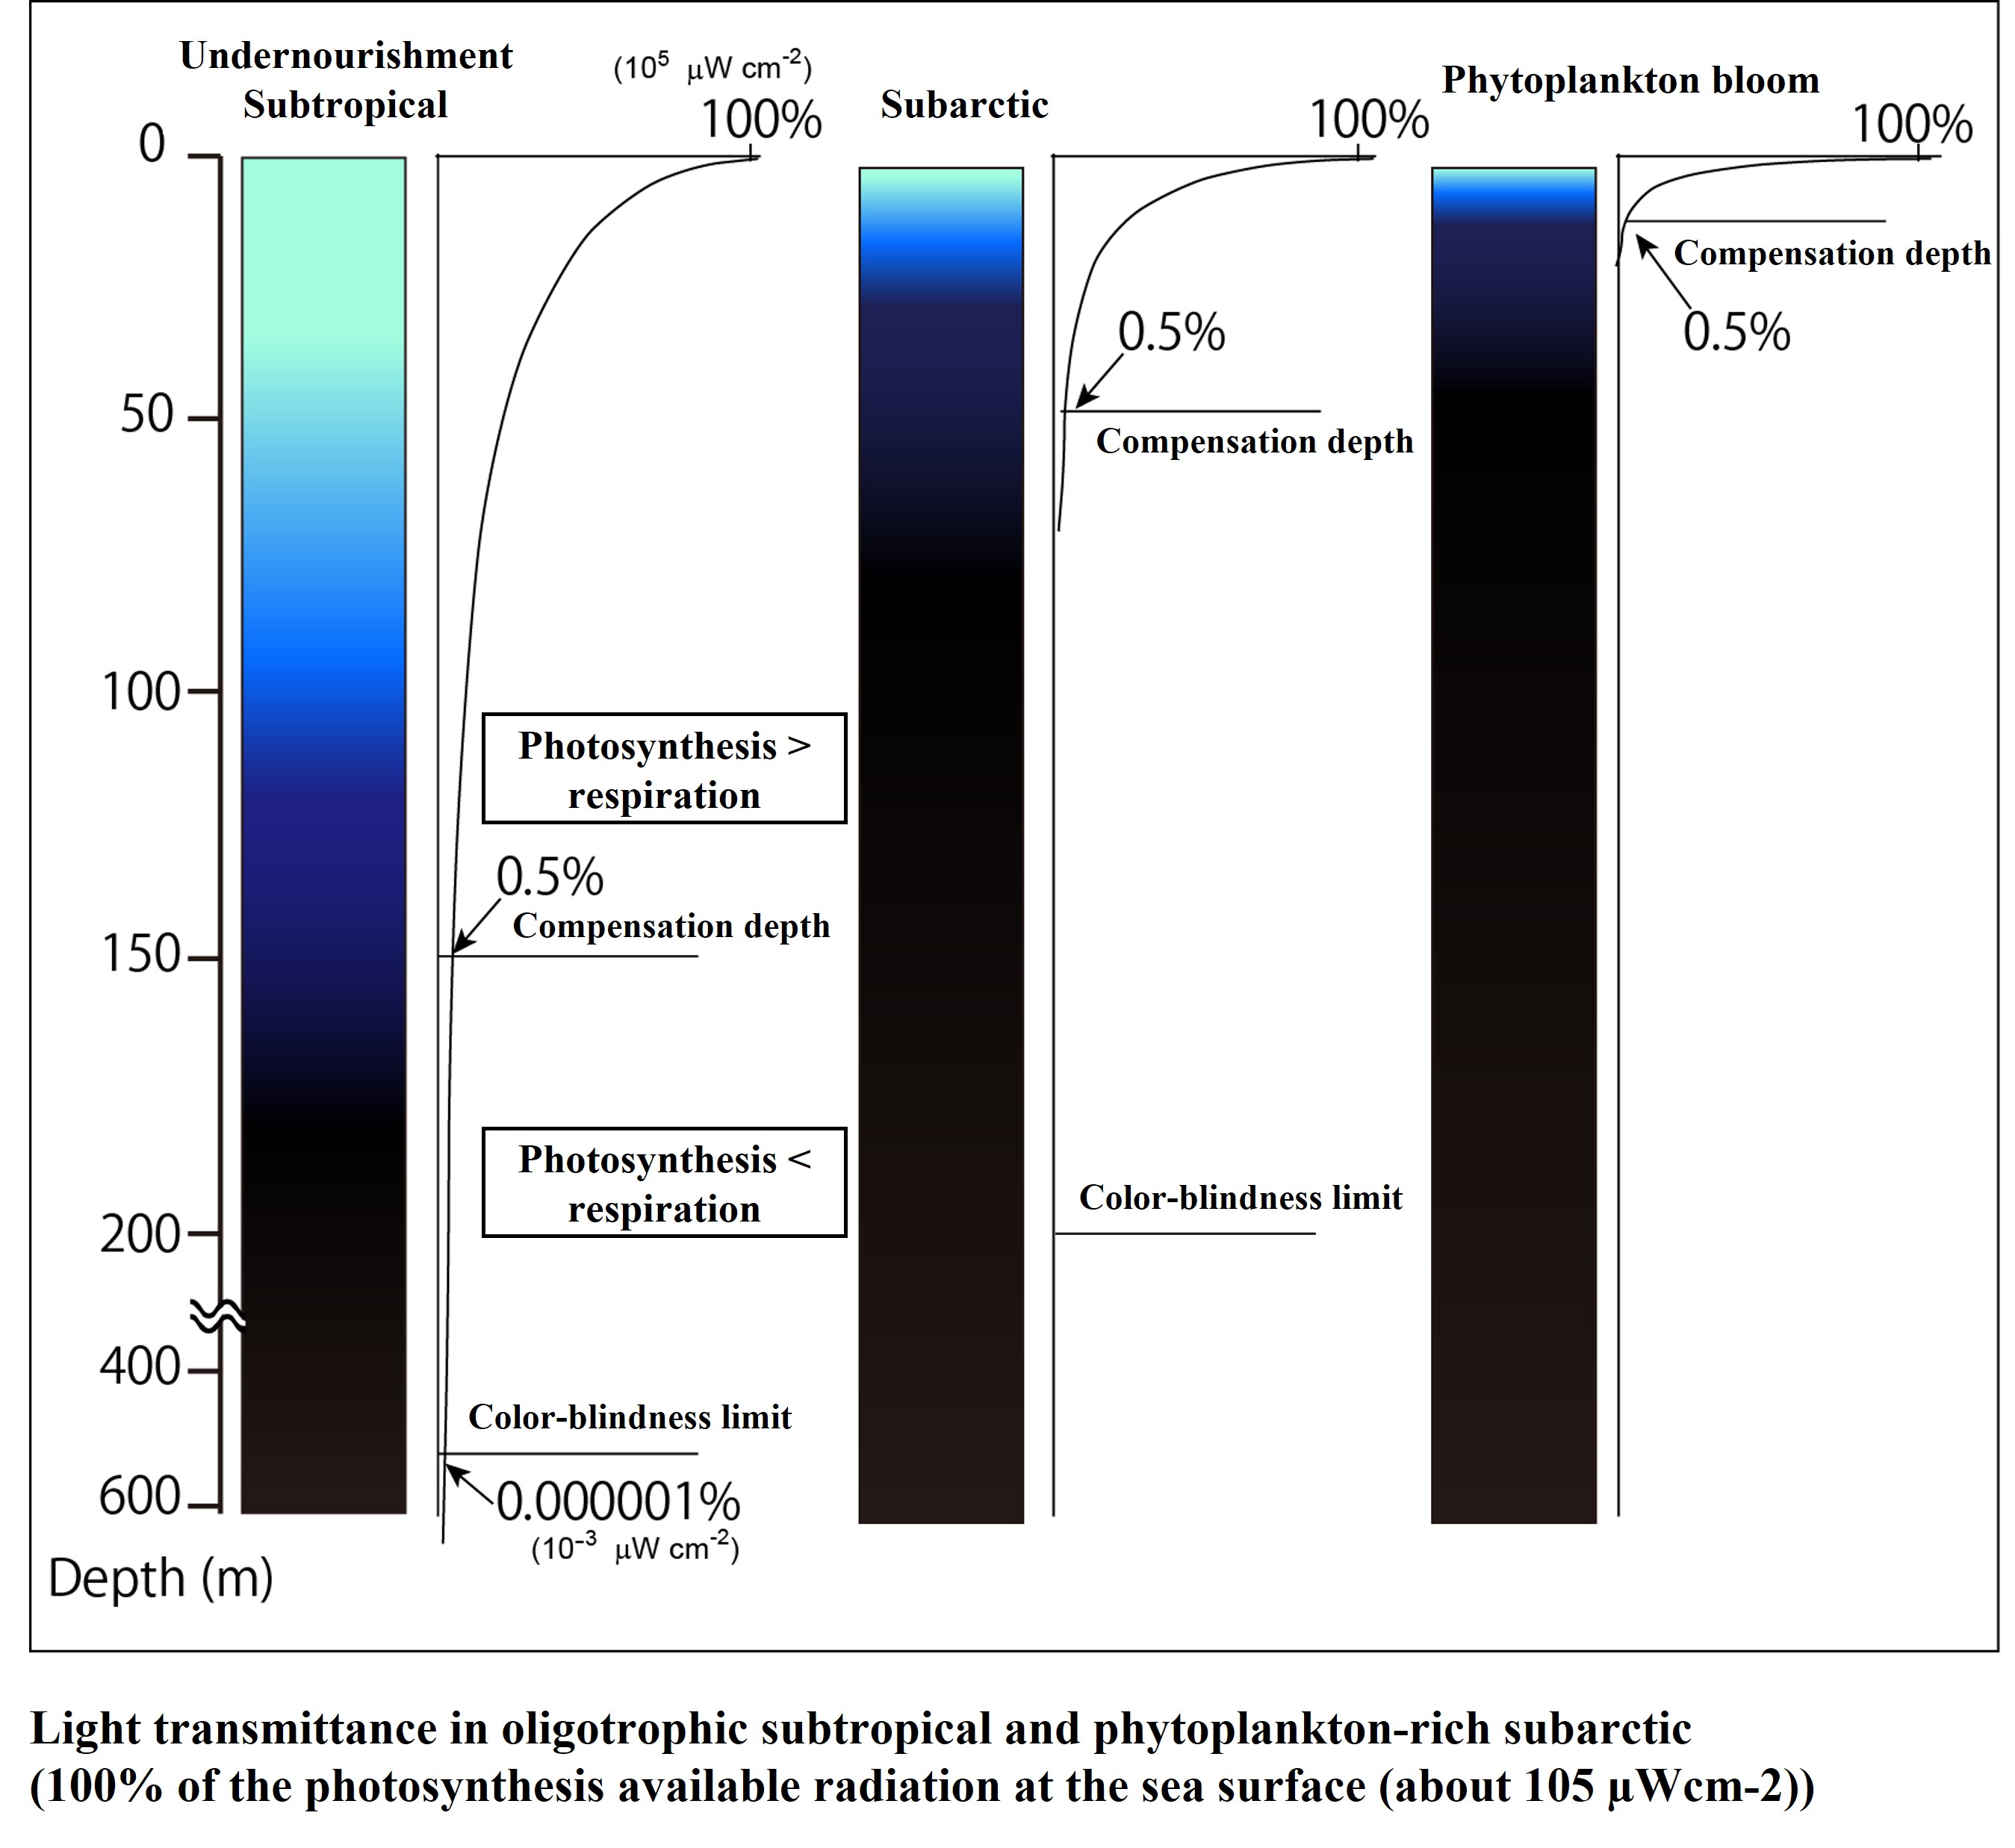
Empirically, it is known that the euphotic layer depth corresponds to the depth at which sunlight falling on the ocean surface attenuates to about 0.5 to 1%. The euphotic layer depth, or the depth at which "photosynthesis = respiration", is also called the "compensation depth". The euphotic layer depth can be as shallow as 20 m in areas where there are many biological particles and significant sunlight attenuation, or it can be deeper than 150 m in subtropical areas where there are only sparse organisms.
Below is an illustration of the depth of light penetration in an oligotrophic subtropical and a nutrient-rich, bioparticle-rich subarctic. In the surface layer of the oligotrophic sea, we can recognize objects several tens of meters away, whereas in the area of phytoplankton blooms, we cannot even see a few meters away.
-
Seasonal changes in euphotic layer depth
The depth distribution of Photosynthesis Available Radiation (PAR) reaching seawater in Funka-Bay is shown in the figure below. The euphotic layer depth (assumed to be the depth at which PAR is attenuated to 1% of the surface ratio) is indicated by the arrow. 1 (μmol photon m-2 s-1 ) of PAR is considered to be pitch-dark. 20 m depth was pitch-dark during the spring bloom in March (Mar). After March, the light started to penetrate to deeper depths in April and May. This is due to the fact that particles (mainly phytoplankton) in the seawater decreased from spring to summer.
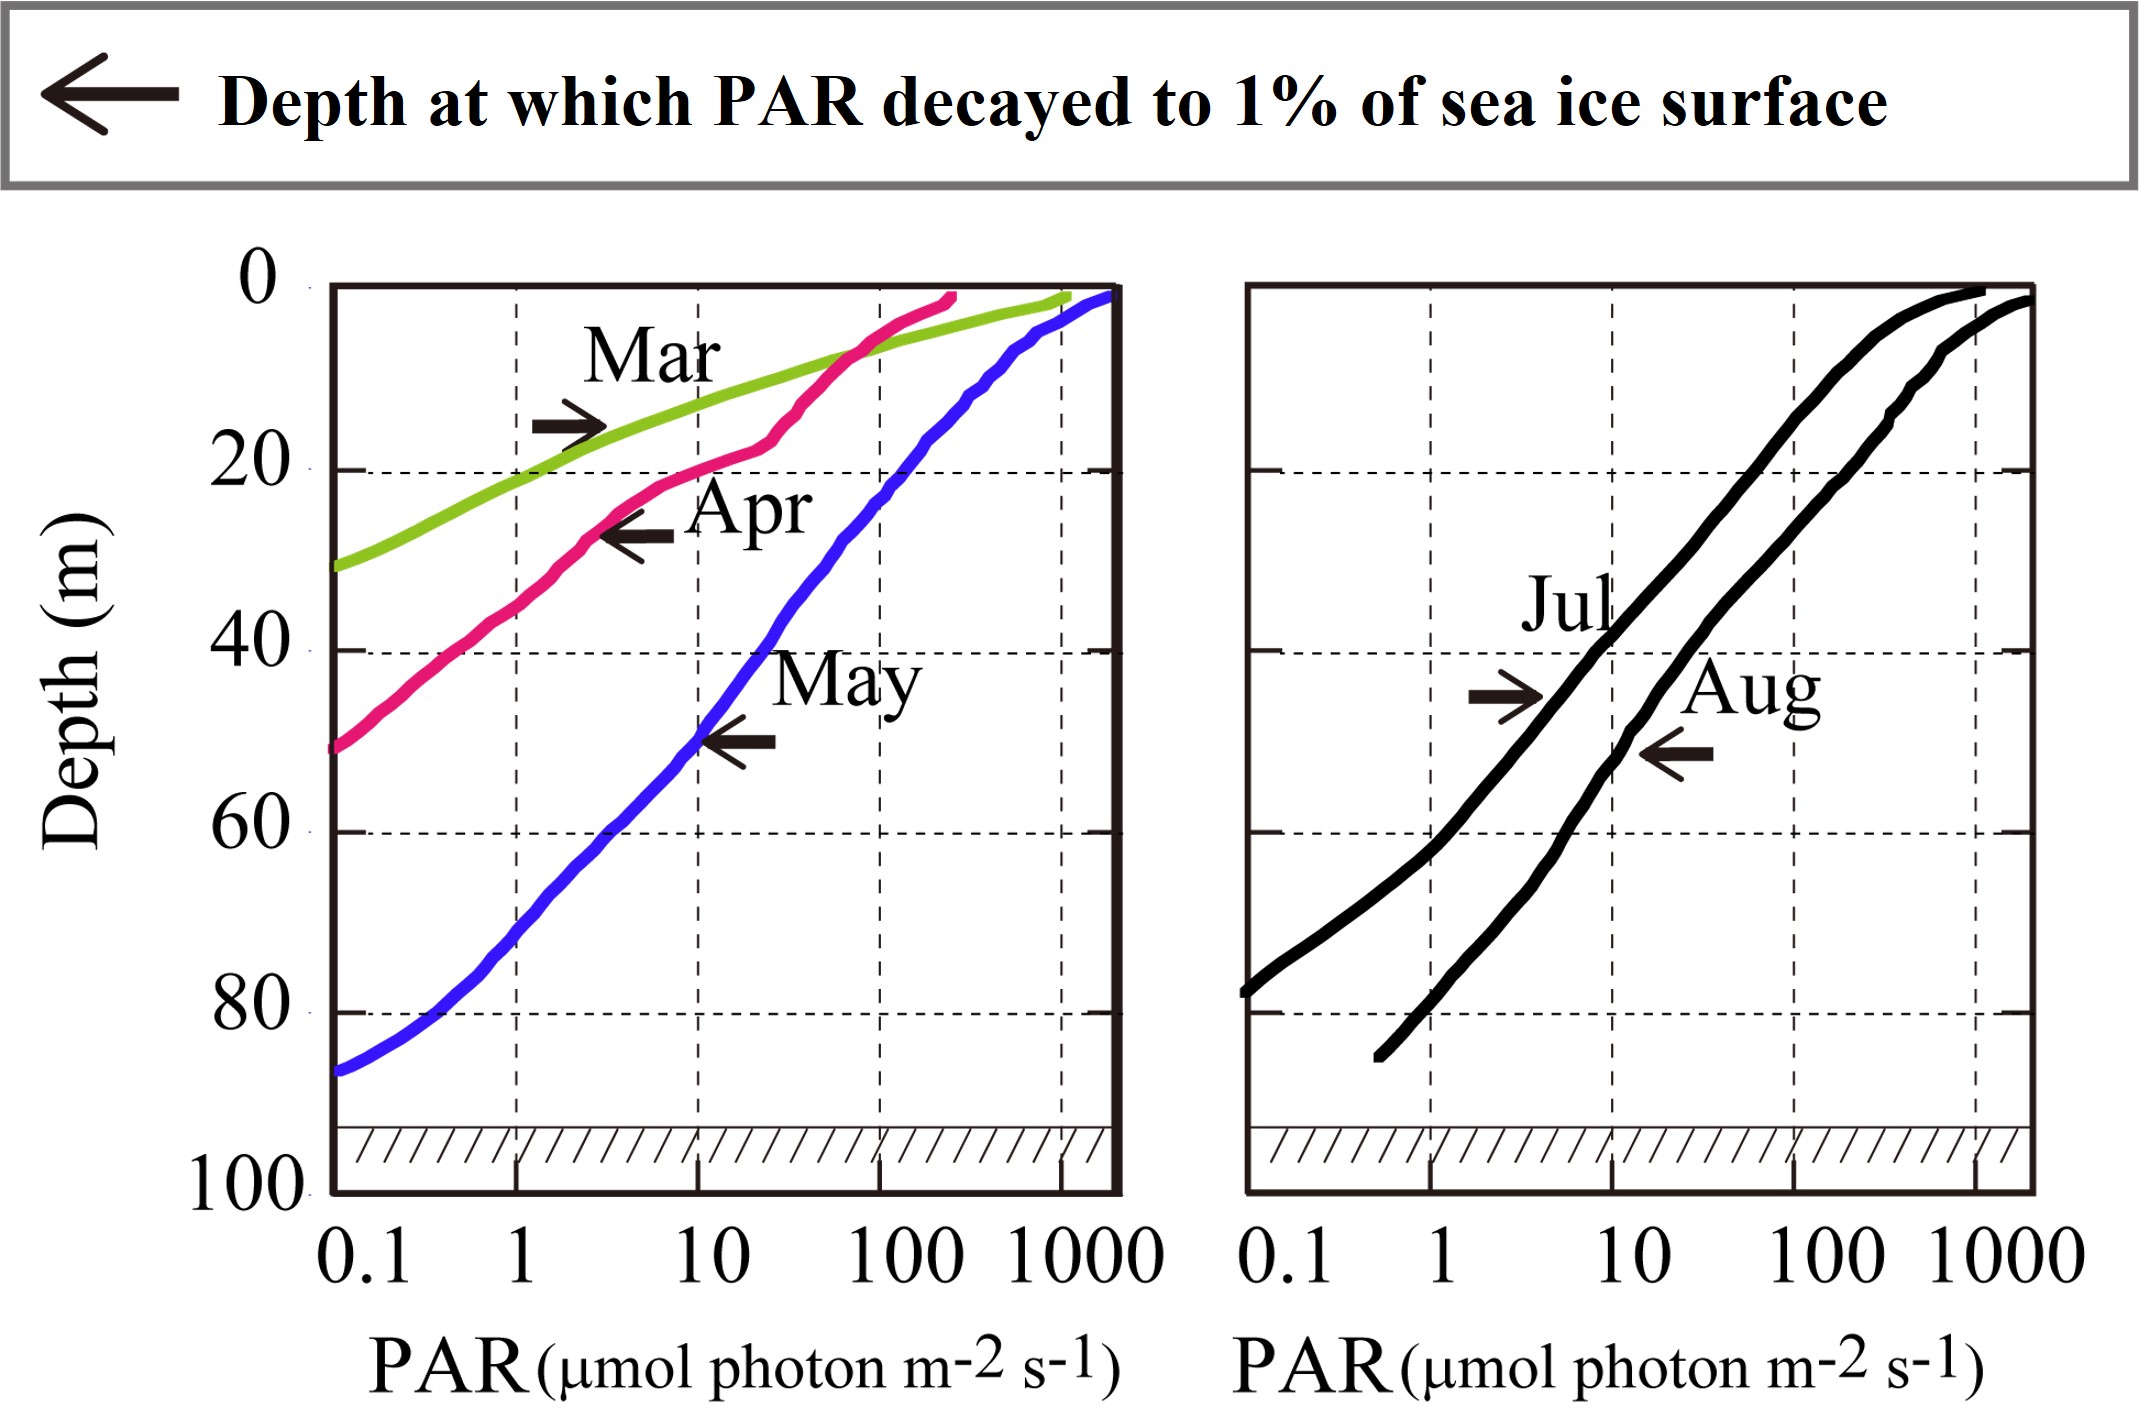
(Modified figure from Ooki et al., Journal of oceanography, 2019, doi.org/10.1007/s10872-019-00517-6)
Why is the depth at which the ocean surface PAR has decayed to 1 % considered the euphotic layer depth? When conducting oceanographic observations, natural light environment conditions are not constant, such as sunny days, cloudy days, mornings, and afternoons. Therefore, it is not possible to compare the amount of PAR at a given depth at the time of observation. However, if the depth at which the PAR falling on the ocean surface decays to 1%, it can be assumed to be the same to some extent, even if the light environment conditions change. In fact, we know empirically from many oceanographic observations that the depth at which PAR reaches 1% of the surface to depth ratio is the compensation depth (photosynthesis = respiration).
-
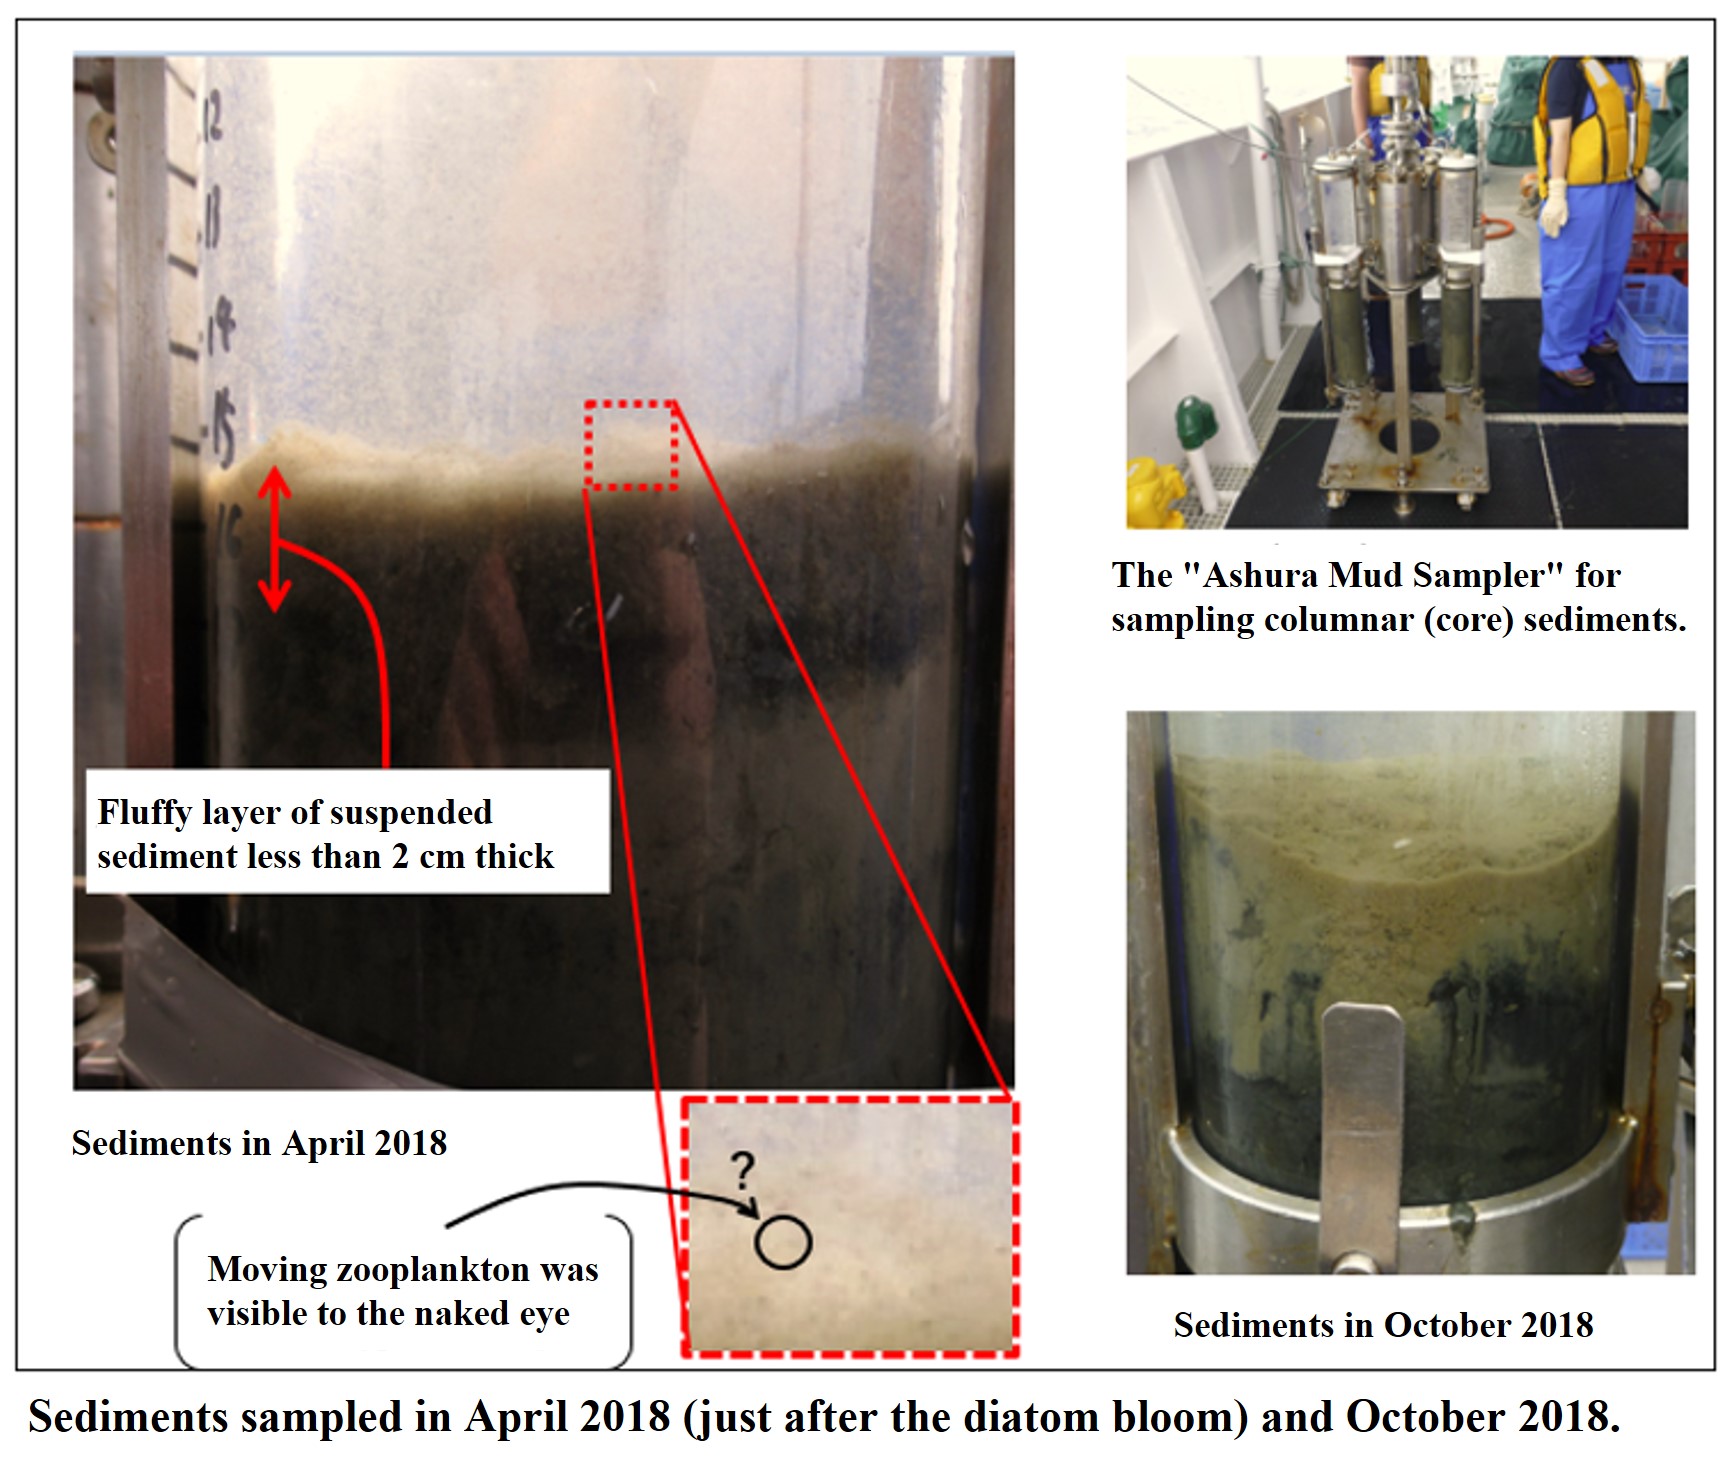
Seafloor sediments after spring bloom
Seafloor sediments were sampled in April, just after the diatom bloom, using an ashura mud sampler (top right in the photo below). The sediment surface is shown in the photo below (left). The surface of the sediment was covered with a layer of diatom suspension, which was less than 2 cm thick, although it is difficult to see in the photo. In addition, zooplankton larvae were seen flitting about in the diatom suspension on the sediment surface, as well as brittle star larvae. In October (lower right in the photo below), the diatom suspension-like blur was not seen. It is believed to have been fed on by animals and bacteria on the seafloor.
-