Perfilado de sección

    • Teacher

      • YAMAMOTO Jun (Field Science Center for Northern Biosphere (Hakodate))
      • MIYASHITA Kazushi (Field Science Center for Northern Biosphere (Hakodate))
      • UENO Hiromichi (Faculty of Fisheries Sciences)
      • YASUMA Hiroki (Faculty of Fisheries Sciences)
      • TAKAGI Tsutomu (Faculty of Fisheries Sciences)
      • TAKAHASHI Yuki (Faculty of Fisheries Sciences)
      • MINAMI Kenji (Field Science Center for Northern Biosphere (Hakodate))
      • ABE Hiroto (Faculty of Fisheries Sciences)
      • KASAI Akihide (Faculty of Fisheries Sciences)
      • KOMEYAMA Kazuyoshi (Faculty of Fisheries Sciences)

    • [Behavioral ecology experiments]

      1. Basic experiments on biotelemetry and biologging technologies

      2. 3D measurement experiment using a stereo camera


      [Satellite data analysis - microwave remote sensing]

      1. Examine the values and formats contained in satellite microwave remote sensing data, such as sea surface temperature, sea surface altitude, and sea surface winds

      2. How to use software to process, analyze, and visualize satellite microwave remote sensing data

      3. After conducting multi-sensor data analysis and plotting the figures, the participants will discuss the physical phenomena seen at the sea surface


      [Ocean observation data analysis]

      1. How to calculate basic parameters of the physical marine environment, such as potential water temperature and density

      2. How to use software for processing, analyzing, and visualizing ocean observation data

      3. Create diagrams necessary for understanding the physical oceanographic environment, such as temperature-salinity cross sections and TS diagrams, from oceanographic observation data, and discuss spatio-temporal variations in the physical oceanographic environment


      [Fish swimming dynamics]

      1. Swimming motion is quantitatively evaluated from the acquired images by taking video of the swimming state using a circular flow tank.

      2. Analysis of the relationship between the propulsive mobility of fish and parameters related to swimming motion


      [Experiments on behavior measurement by image processing]

      1. Take pictures of the fish swimming freely in the experimental tank

      2. Automatic detection of fish positions and visualization of movement trajectories through image processing

      3. Consider the impact of frame rate, threshold, and color space selection on the results.


      [Fisheries and ocean engineering]

      1. Fundamentals of fluid mechanics and floating body kinematics

      2. Measurement and data analysis of the motion of a floating body using a large water tank

      3. Measurement and data analysis of fluid forces acting on an object by a circulating water tank


      [Fisheries information engineering, numerical fluid analysis]

      1. Fundamentals of numerical fluid analysis

      2. Model design by CAD

      3. Numerical fluid analysis

    • Behavior measurement using image processing【Instructor: YONEYAMA】

      Among the many methods of behavior measurement, this course focuses on behavior measurement using image processing, which is non-contact and non-intrusive to the target fish, and teaches how to detect and track the position of fish (moving objects) by performing image processing of video and image data.

      図

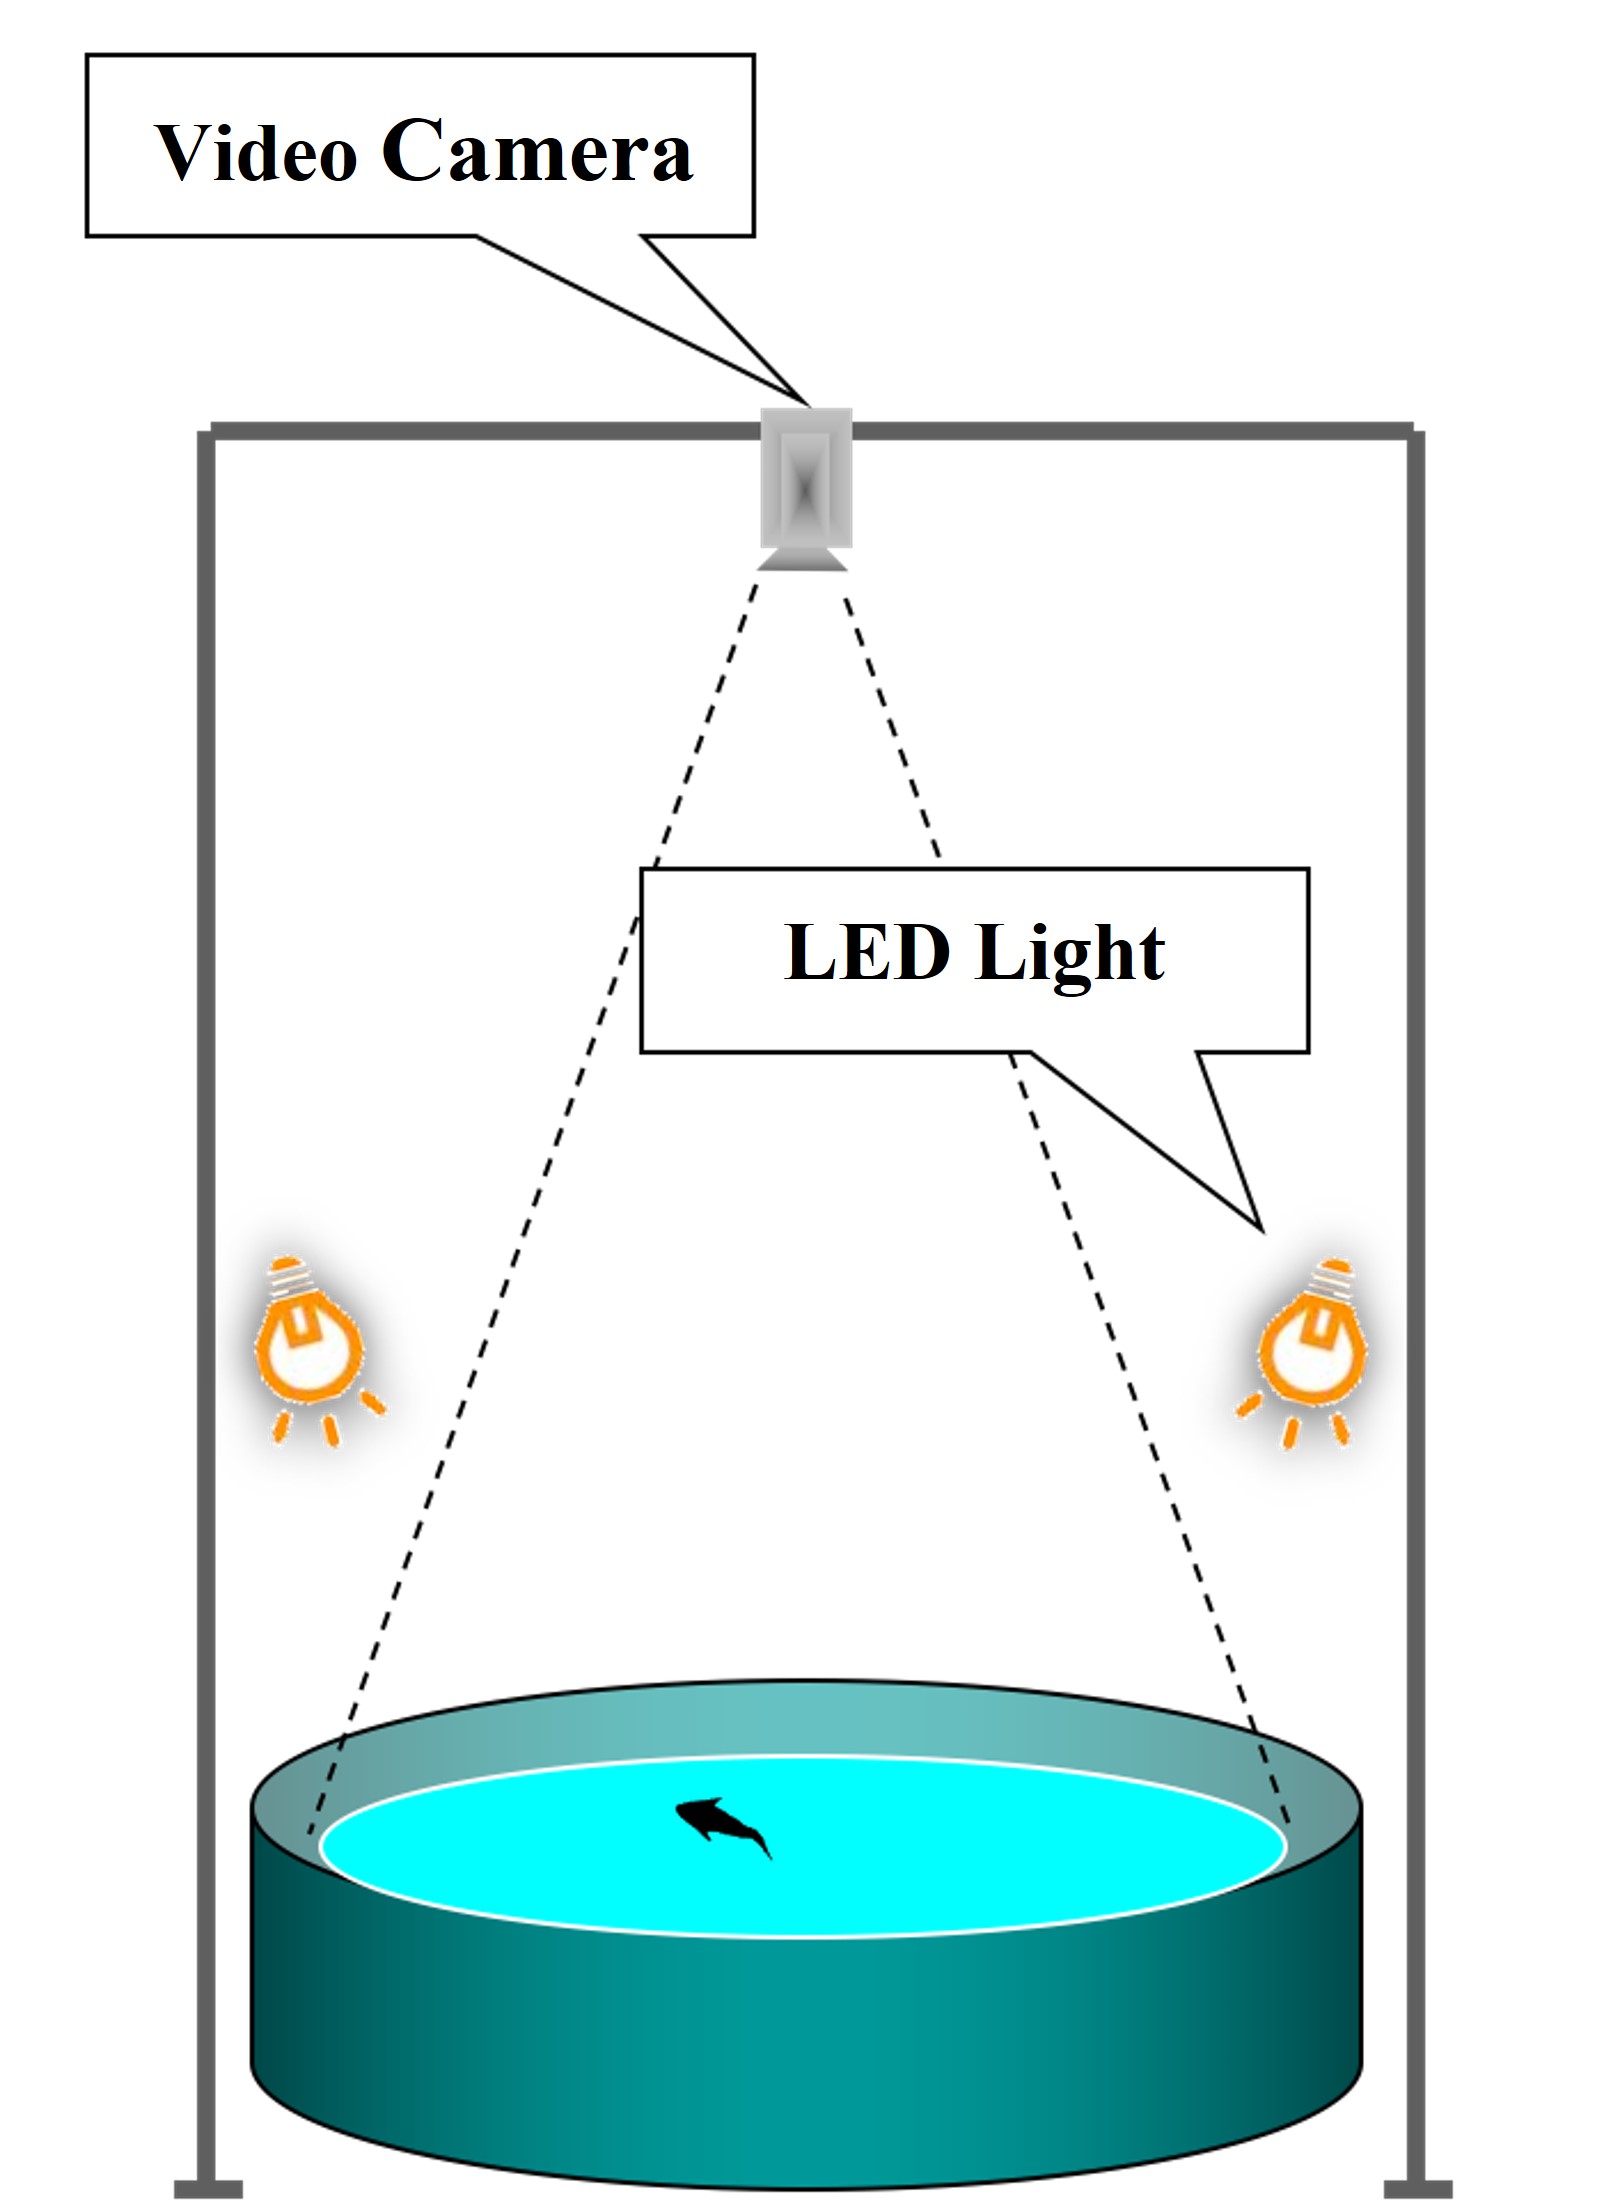
      The position of fish can be detected and traced for each frame of video using image processing to automatically plot their movement trajectory. Analysis of the movement trajectory enables the user to determine swimming speed, curvature, distance from the tank wall, etc., and to understand behavior patterns.


    • Ocean observation data analysisInstructor UENO

      The Oshoro-Maru, a training ship attached to the Faculty of Fisheries, has conducted numerous oceanographic observations. Among them, the observation of the 155°E north-south line has been conducted continuously since the 1980s, and its data is very valuable for understanding long-term changes in the ocean area east of Honshu. In this experiment, using the Oshoro Maru 155°E observation as an example, you will learn how to analyze data to investigate spatio-temporal variations in the interior of the ocean from ocean observation data.

      Translated with DeepL

      Example of data obtained from the Oshoro Maru oceanographic observation in May 2006


    • Fisheries information engineering, numerical fluid analysis【Instructor YASUMA・TAKAHASHI】

      〜Visualization of flow fields occurring in a breeding tank

      In aquaculture production, it is known that mass die-offs can occur depending on the setting of water flow, since the swimming ability of fish when they are juveniles is poor and easily affected by the flow field in the tank. In this experiment, the flow in the aquaculture tank, which cannot be confirmed visually, will be analyzed using CFD (Computational Fluild Dynamics) analysis and visualization experiments.

      Flow visualization experiment on a breeding tank model

      Simulation of flow field in a breeding tank model by CFD analysis